Explore the ScaleUp Annual Review 2023
Select a section to expand and explore this year's review..
CONTENTS

Introduction 2023

Chapter 1 2023
The ScaleUp Business Landscape

Chapter 2 2023

Chapter 3 2023
GROWTH RATES ANALYSIS FOR SCALEUPS AND SCALING PIPELINE BUSINESSES
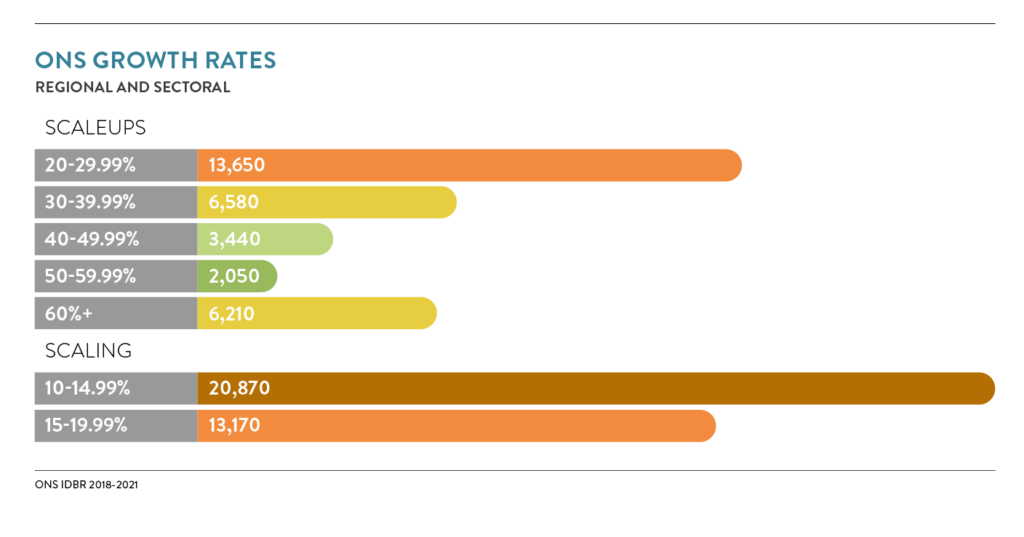
In this analysis we have broken down scaleups into growth segments and we separate out the scaling pipeline to show businesses growing between 10-14.999% and 15-19.999%. This analysis helps in understanding how the overall growth is spread through the different cohorts of scaleup and pipeline businesses. The aim is to better understand the sectoral and regional trends in the number of businesses, and employment or turnover generated by them in the different growth phases of the pipeline and the scaleup journey.
Analytical Notes:
- The overall number of scaleups in this part does not align with the overall number of scaleups shown previously, as scaleups growing by both turnover and employment at different growth rates are double counted (i.e. a business scaling employment between 20-29.999% and turnover between 50-59.999% will be counted both in the 20-20.999% growth segment as an employment scaleup and in the 50-59.999% segment as a turnover scaleup).
- Sector Classification: In this section the analysis was created using Industry Group classification of the 2007 Standard Industrial Classification (UKSIC(2007)), in order to make the small segmentation of the data more robust. The Production sector is a combination of Manufacturing combined with Agriculture and Mining and Energy.
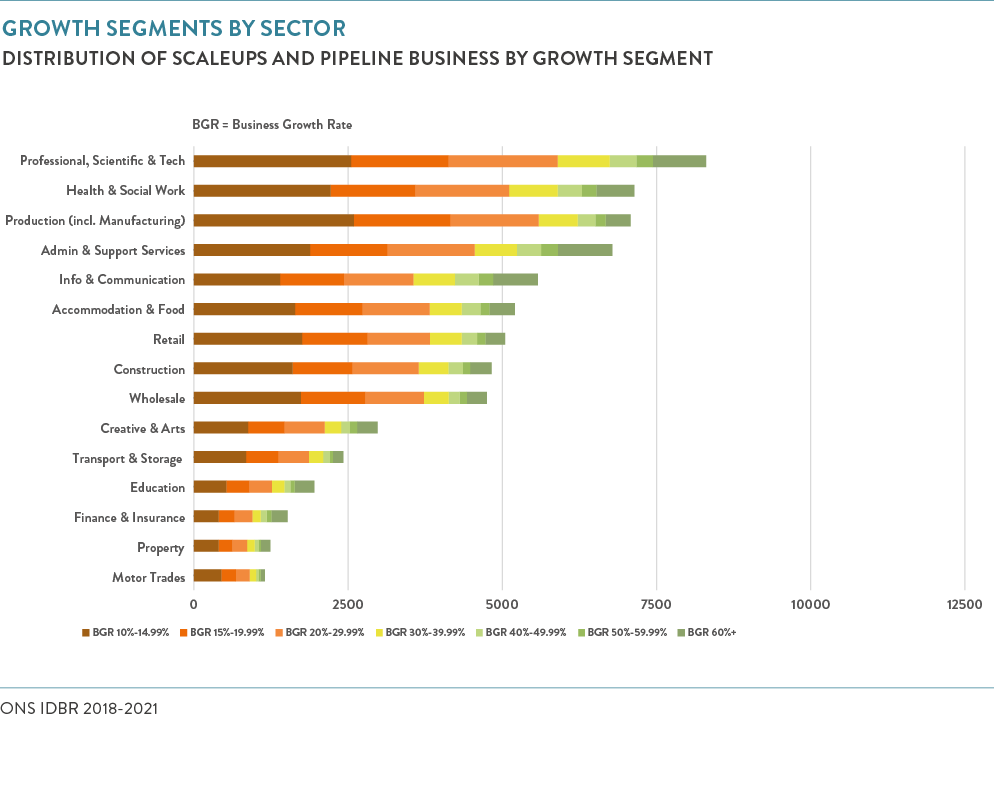
When looking at the overall numbers of businesses growing in turnover and/or employment by more than 10% in 2021, the following patterns emerge:
- Similar to the previous year, Admin & Support Services; Professional, Scientific & Tech; and Information & Communication are the sectors with the most businesses scaling over 60% in their turnover and/or employment.
- Particular growth in the 10-19.99% growth is shown by the Health and Social Work sector, which is now the third biggest sector (from 5th biggest in 2020) in growth after Manufacturing and Professional, Scientific & Tech.
SECTORAL CONTRIBUTION TO EMPLOYMENT & TURNOVER
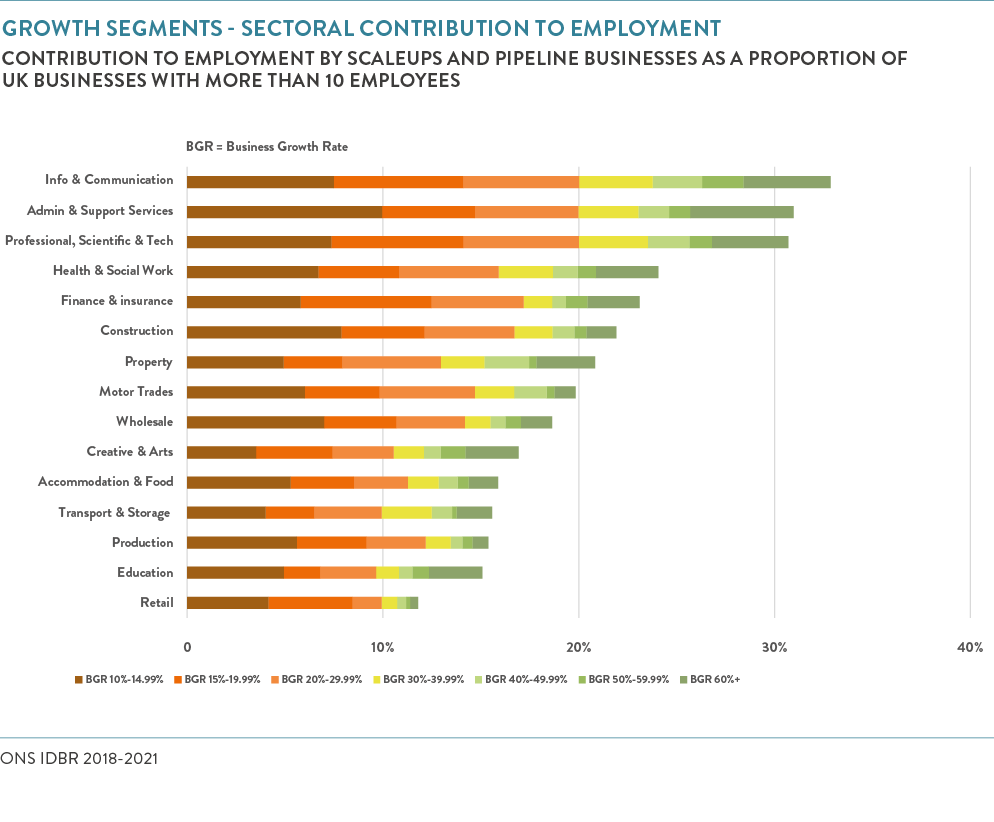
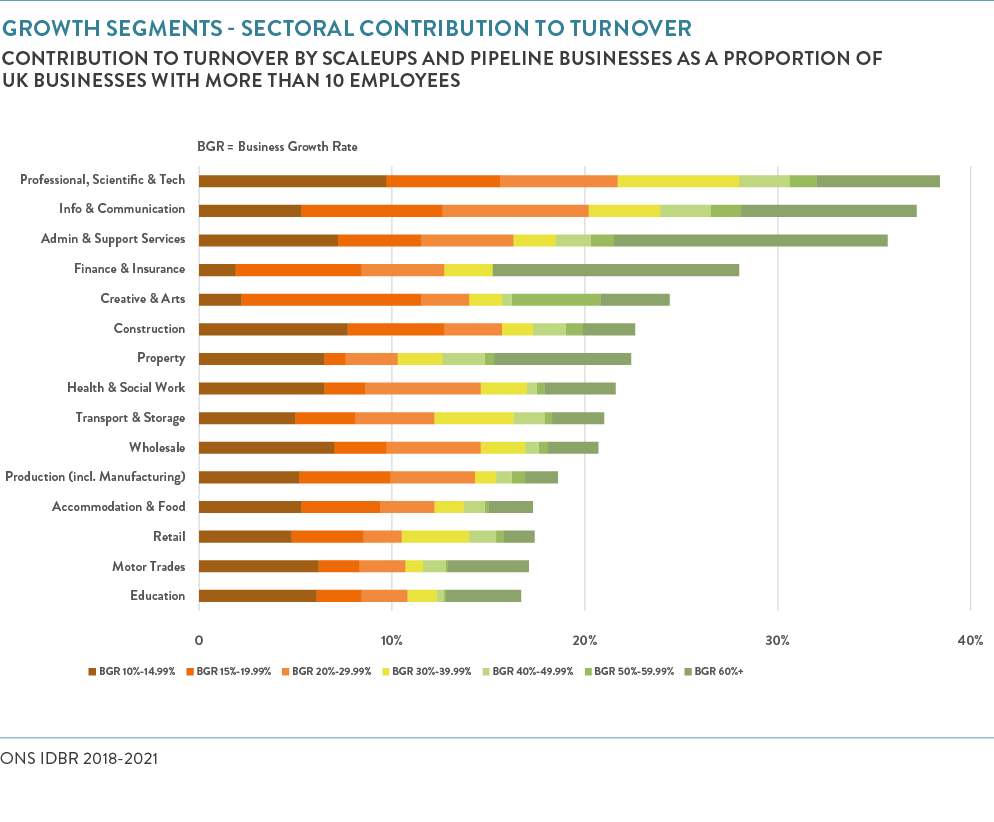
In order to understand the contribution that scaleups and pipeline businesses make towards their overall sector’s turnover and employment, we have analysed each growth segment against the total turnover and employment of all UK businesses with a minimum of 10 employees in 2018 (when these businesses started their current scaling period of 3 years growth).
- Scaling and scaleup businesses in 3 sectors – Information & Communication; Admin & Support Services and Professional, Scientific & Tech – contribute more than 30% of the total employment generated by all UK businesses in these sectors with more than 10 employees three years ago.
- The three biggest sectors contributing to turnover are the same as those contributing highest towards employment
- In the Finance & Insurance sector, the turnover of those growing by 60% is similar to the combined turnover of those growing between 10-59.99%
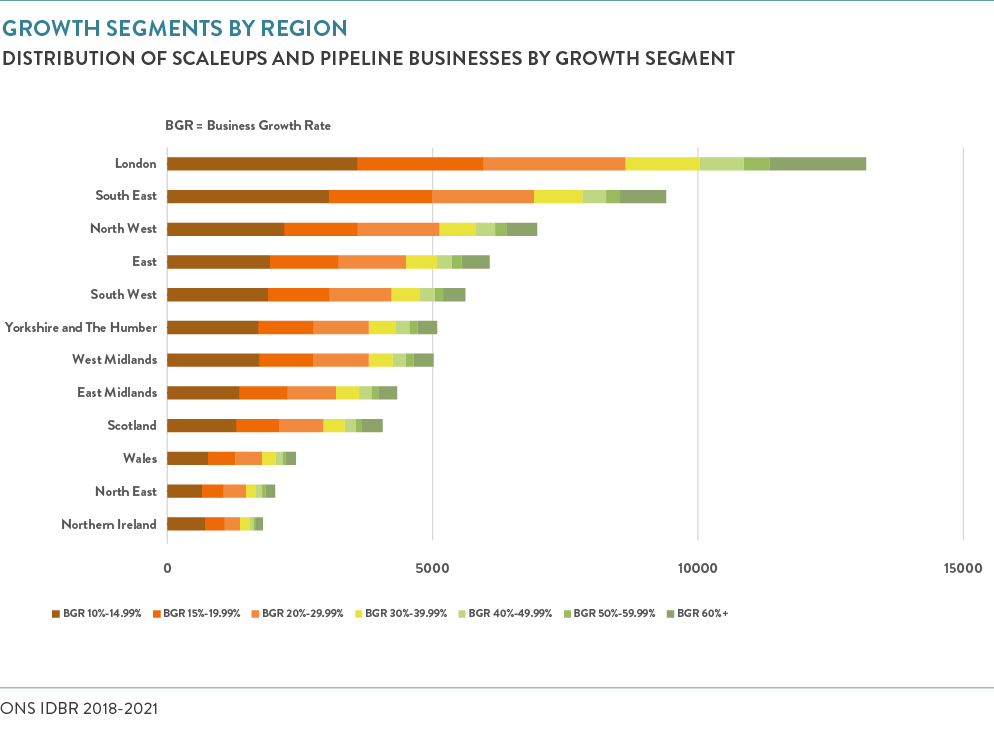
SCALEUP AND SCALING PIPELINE GROWTH SEGMENTS – BY REGION / DEVOLVED NATION
When looking at overall numbers of businesses growing (turnover and/or employment) by more than 10% we are able to see with greater clarity the disparities that exist across the UK.
- For all regions, one in three businesses growing by more than 10% are in the 10-19.99% growth segment except Northern Ireland, where this proportion is 40%.
- London has the highest proportion (14%) of scaleups growing by more than 60% compared to all other regions which are approximately 7-9%.
CONTENTS

Introduction 2023

Chapter 1 2023
The ScaleUp Business Landscape

Chapter 2 2023

Chapter 3 2023


Share