Explore the ScaleUp Annual Review 2023
Select a section to expand and explore this year's review..
CONTENTS

Introduction 2023

Chapter 1 2023
The ScaleUp Business Landscape

Chapter 2 2023

Chapter 3 2023
LOCAL ANALYSIS OF GROWTH IN THE SCALING PIPELINE
As observed with scaleups across the UK, there are businesses in the scaling pipeline in every part of the country, with 67% of pipeline businesses based outside of London and the South East.
PIPELINE DENSITY PER 100K POPULATION
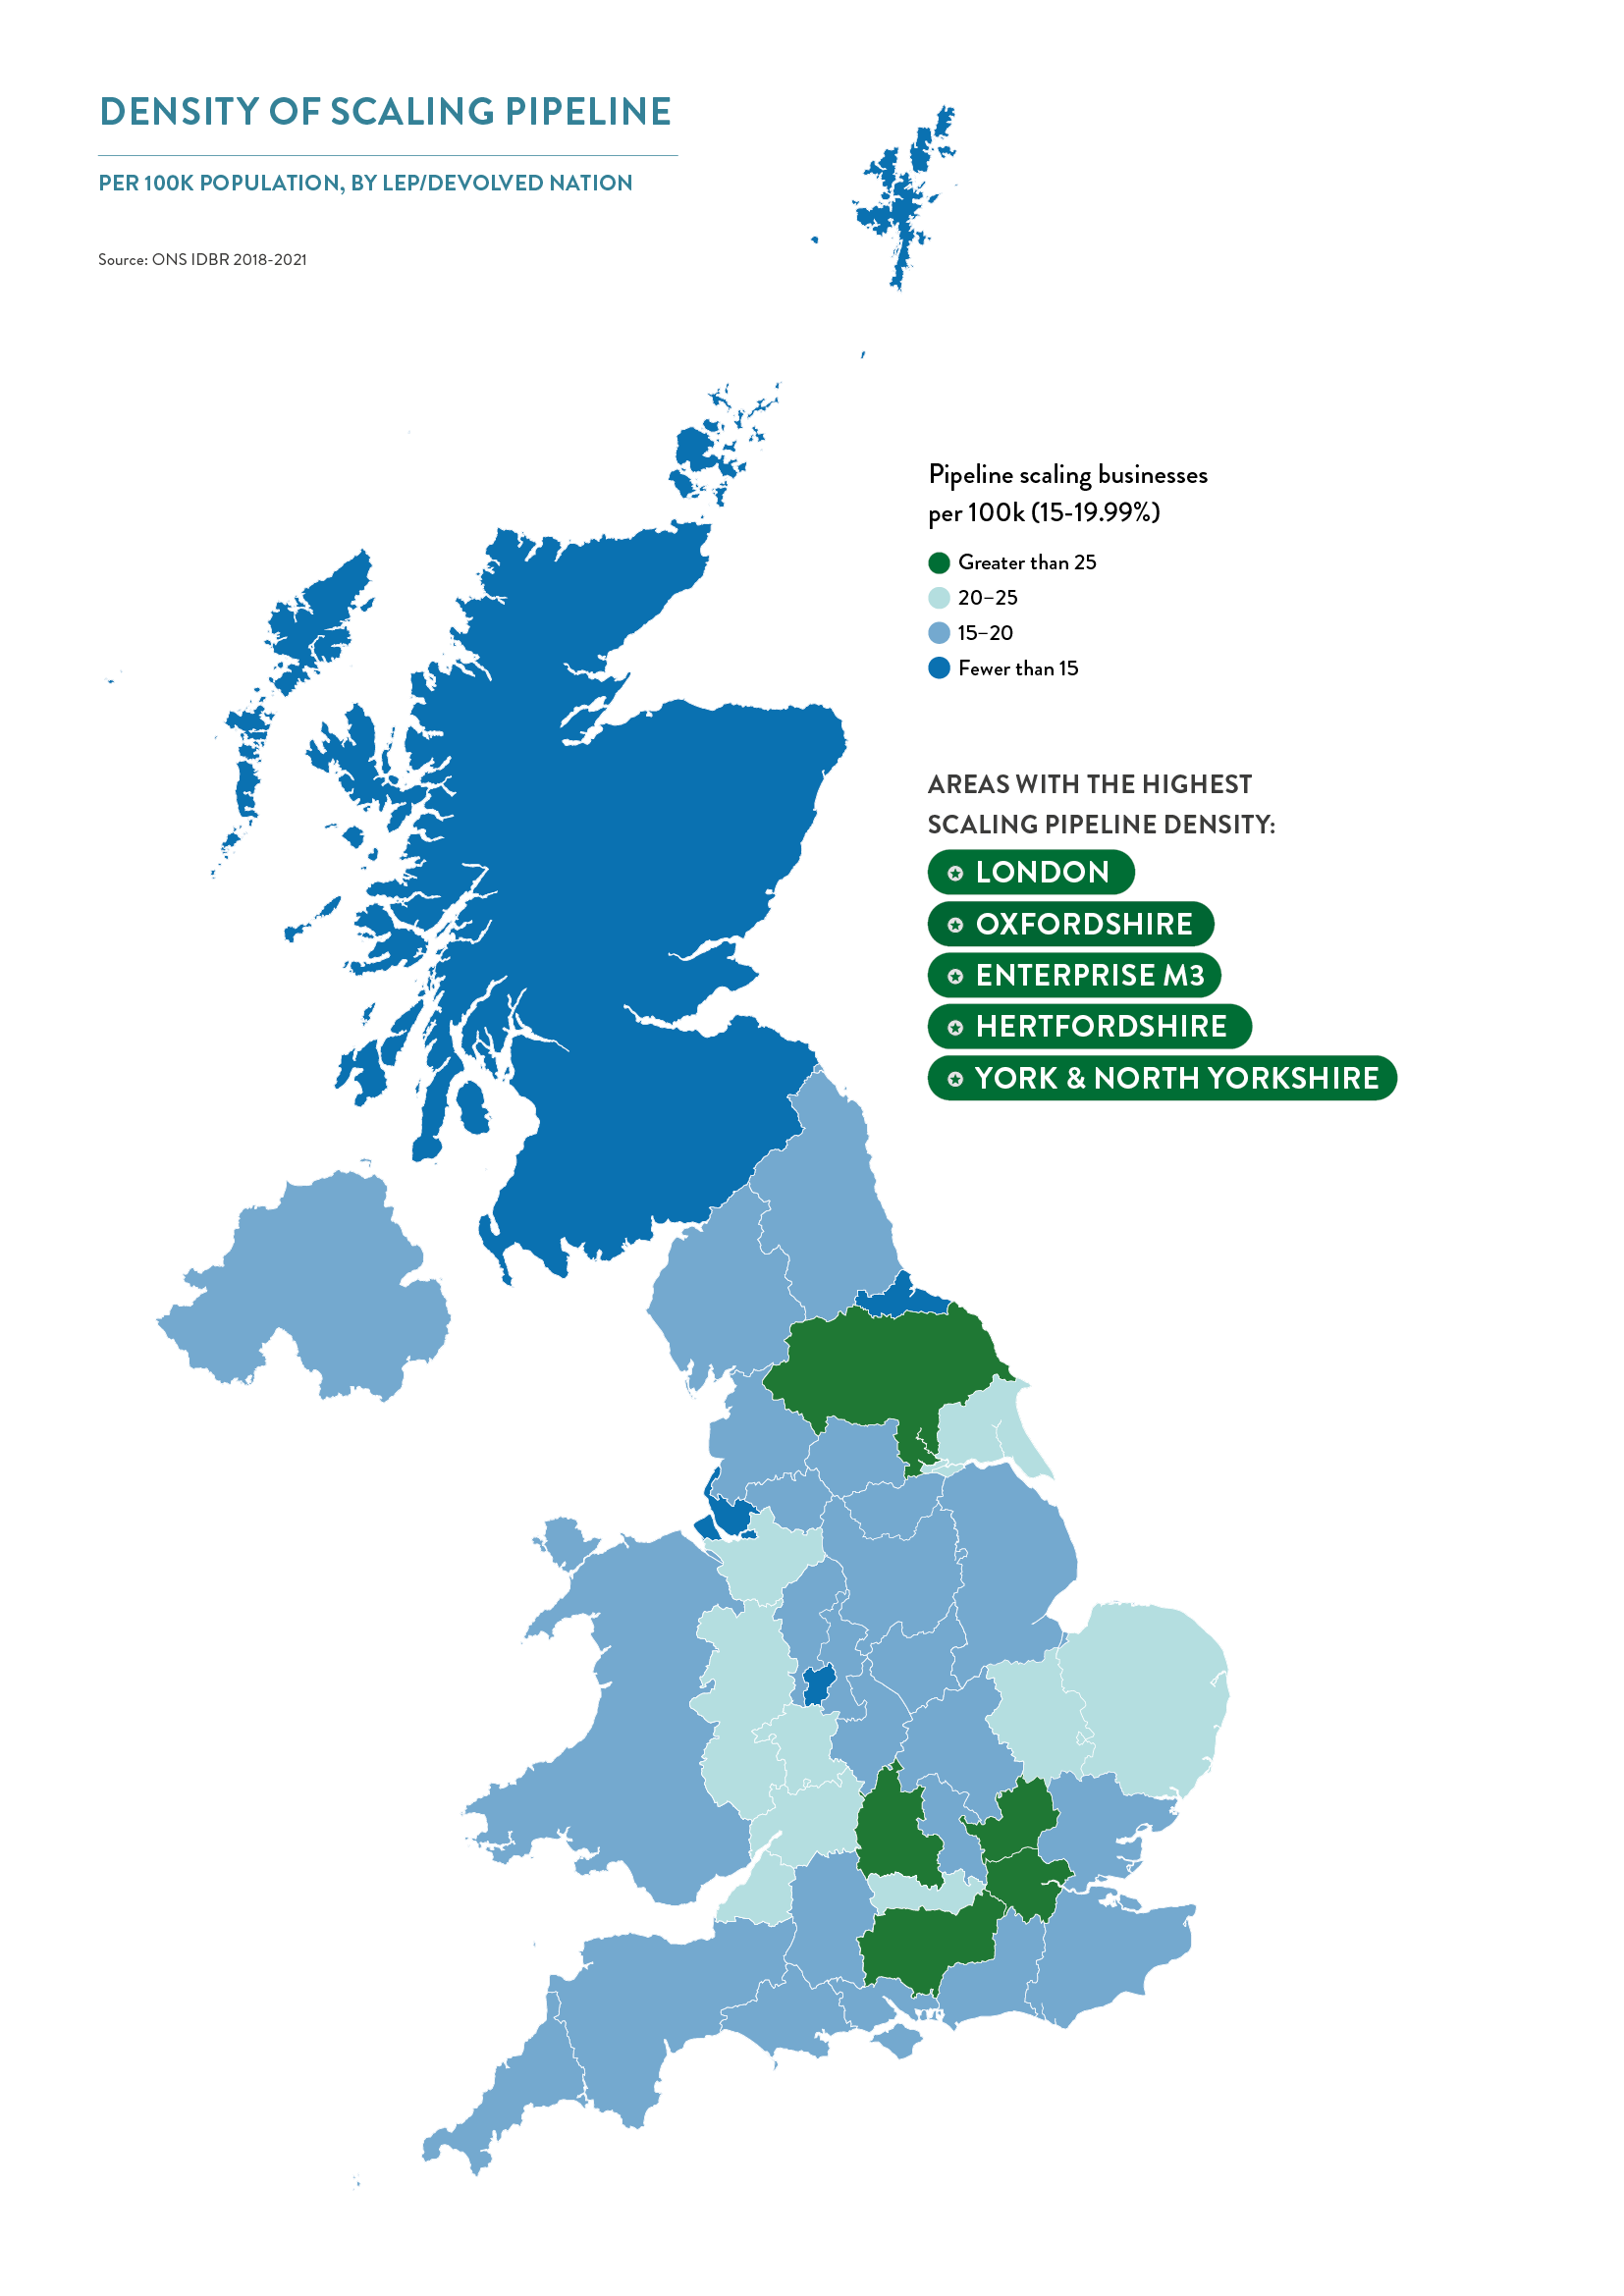
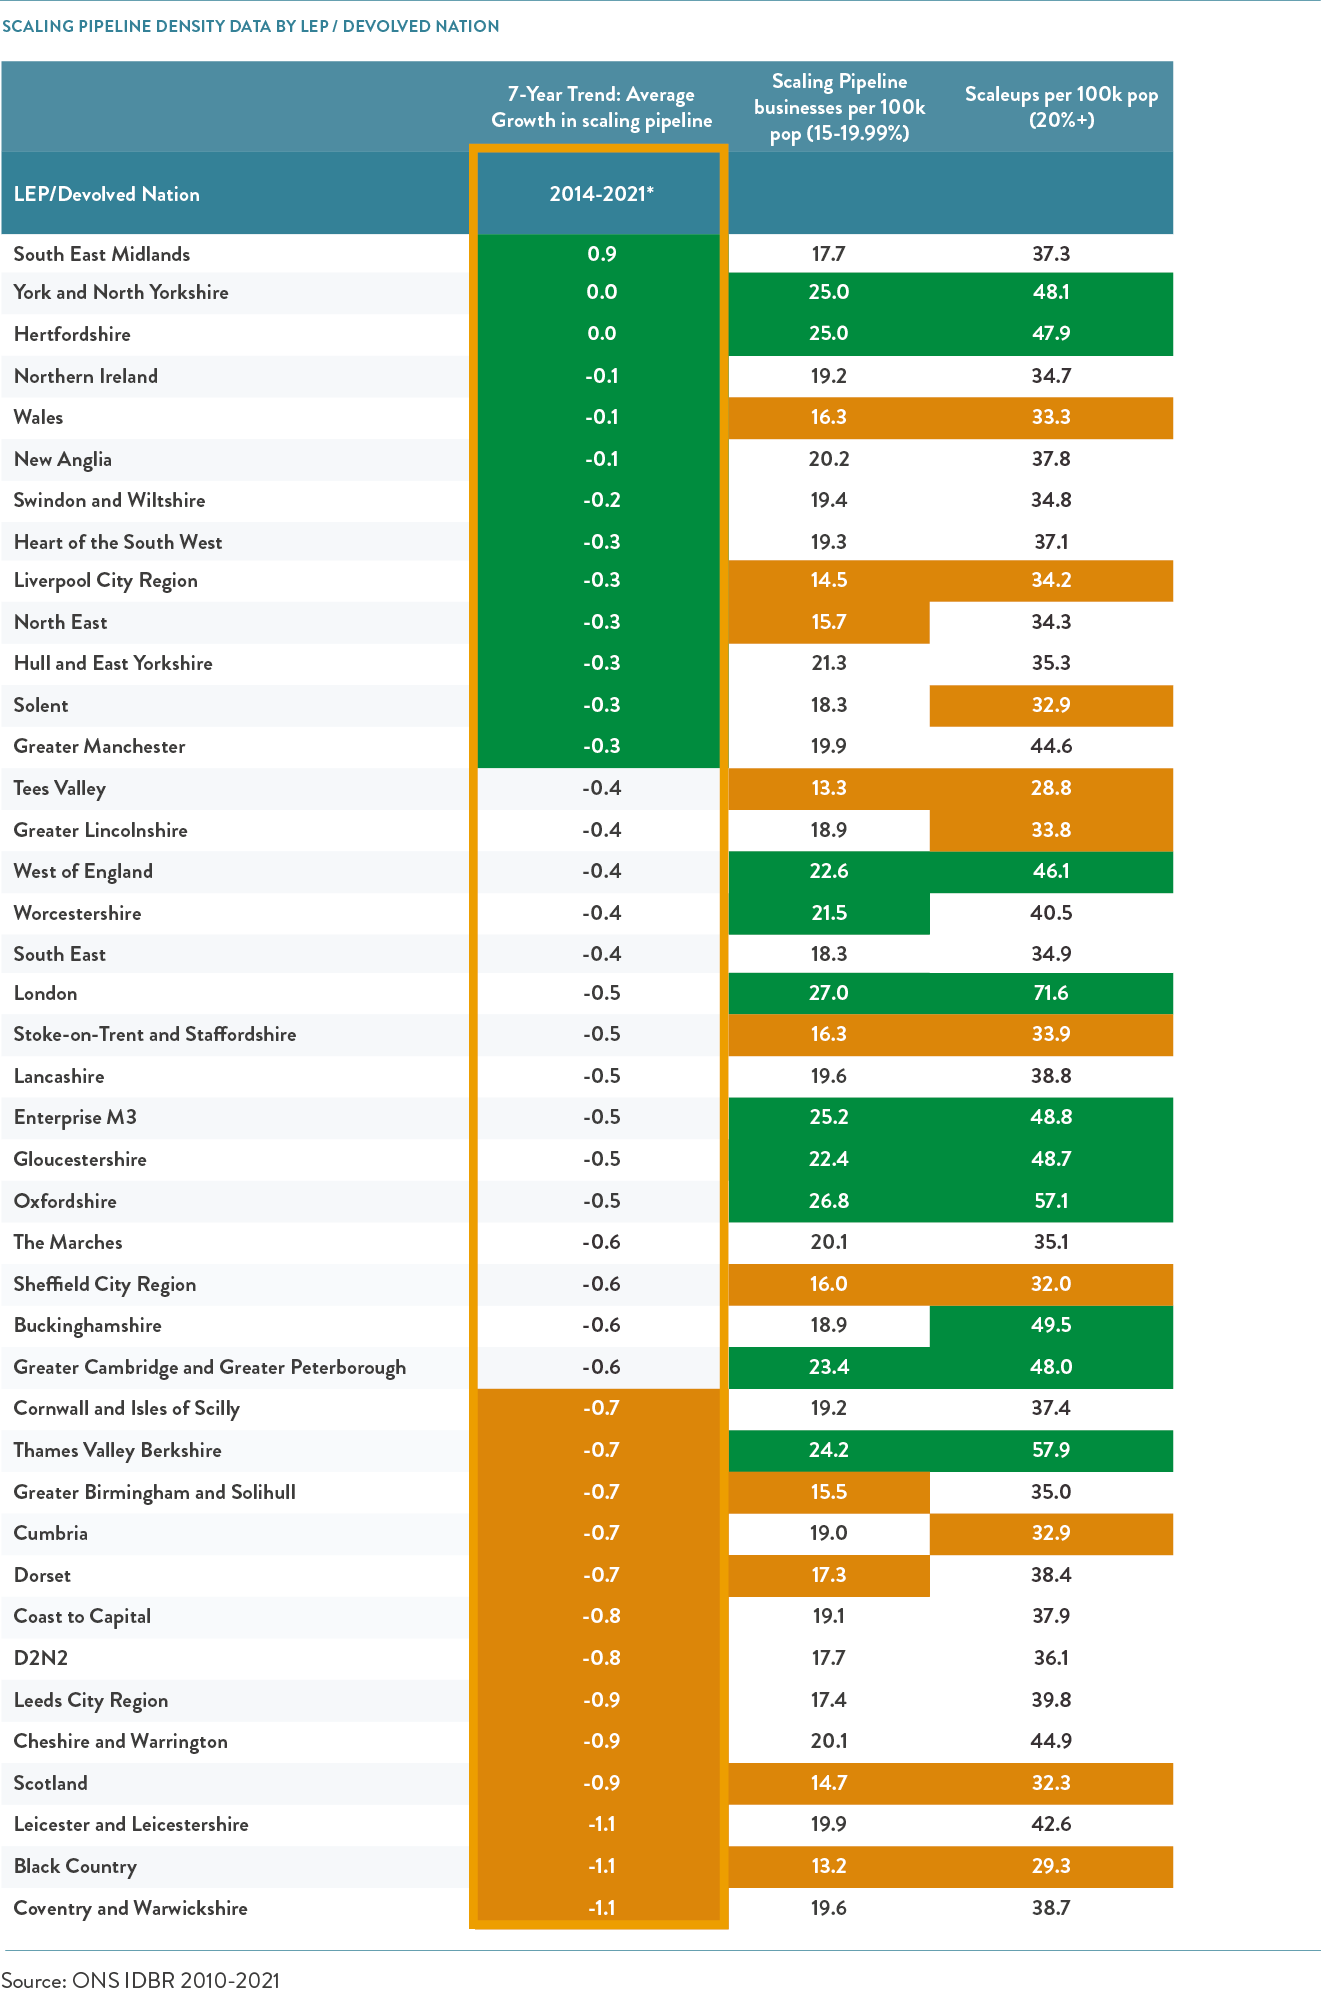
The density of the scaling pipeline per 100k population is also far more consistent than that of scaleup peers, ranging from 13.3 in the Tees Valley to 27 in London (while for scaleups this range is 28.8 to 71.6 per 100k population respectively). Despite this, regional disparities remain and the densest clusters are found in southern England.

PIPELINE GROWTH ACROSS LOCAL AREAS
As with the scaleup population, we looked at trends over time to understand how the scaling pipeline is evolving in the different English localities and devolved nations of the UK. Through this analysis and in comparison with the scaleup population we observe:
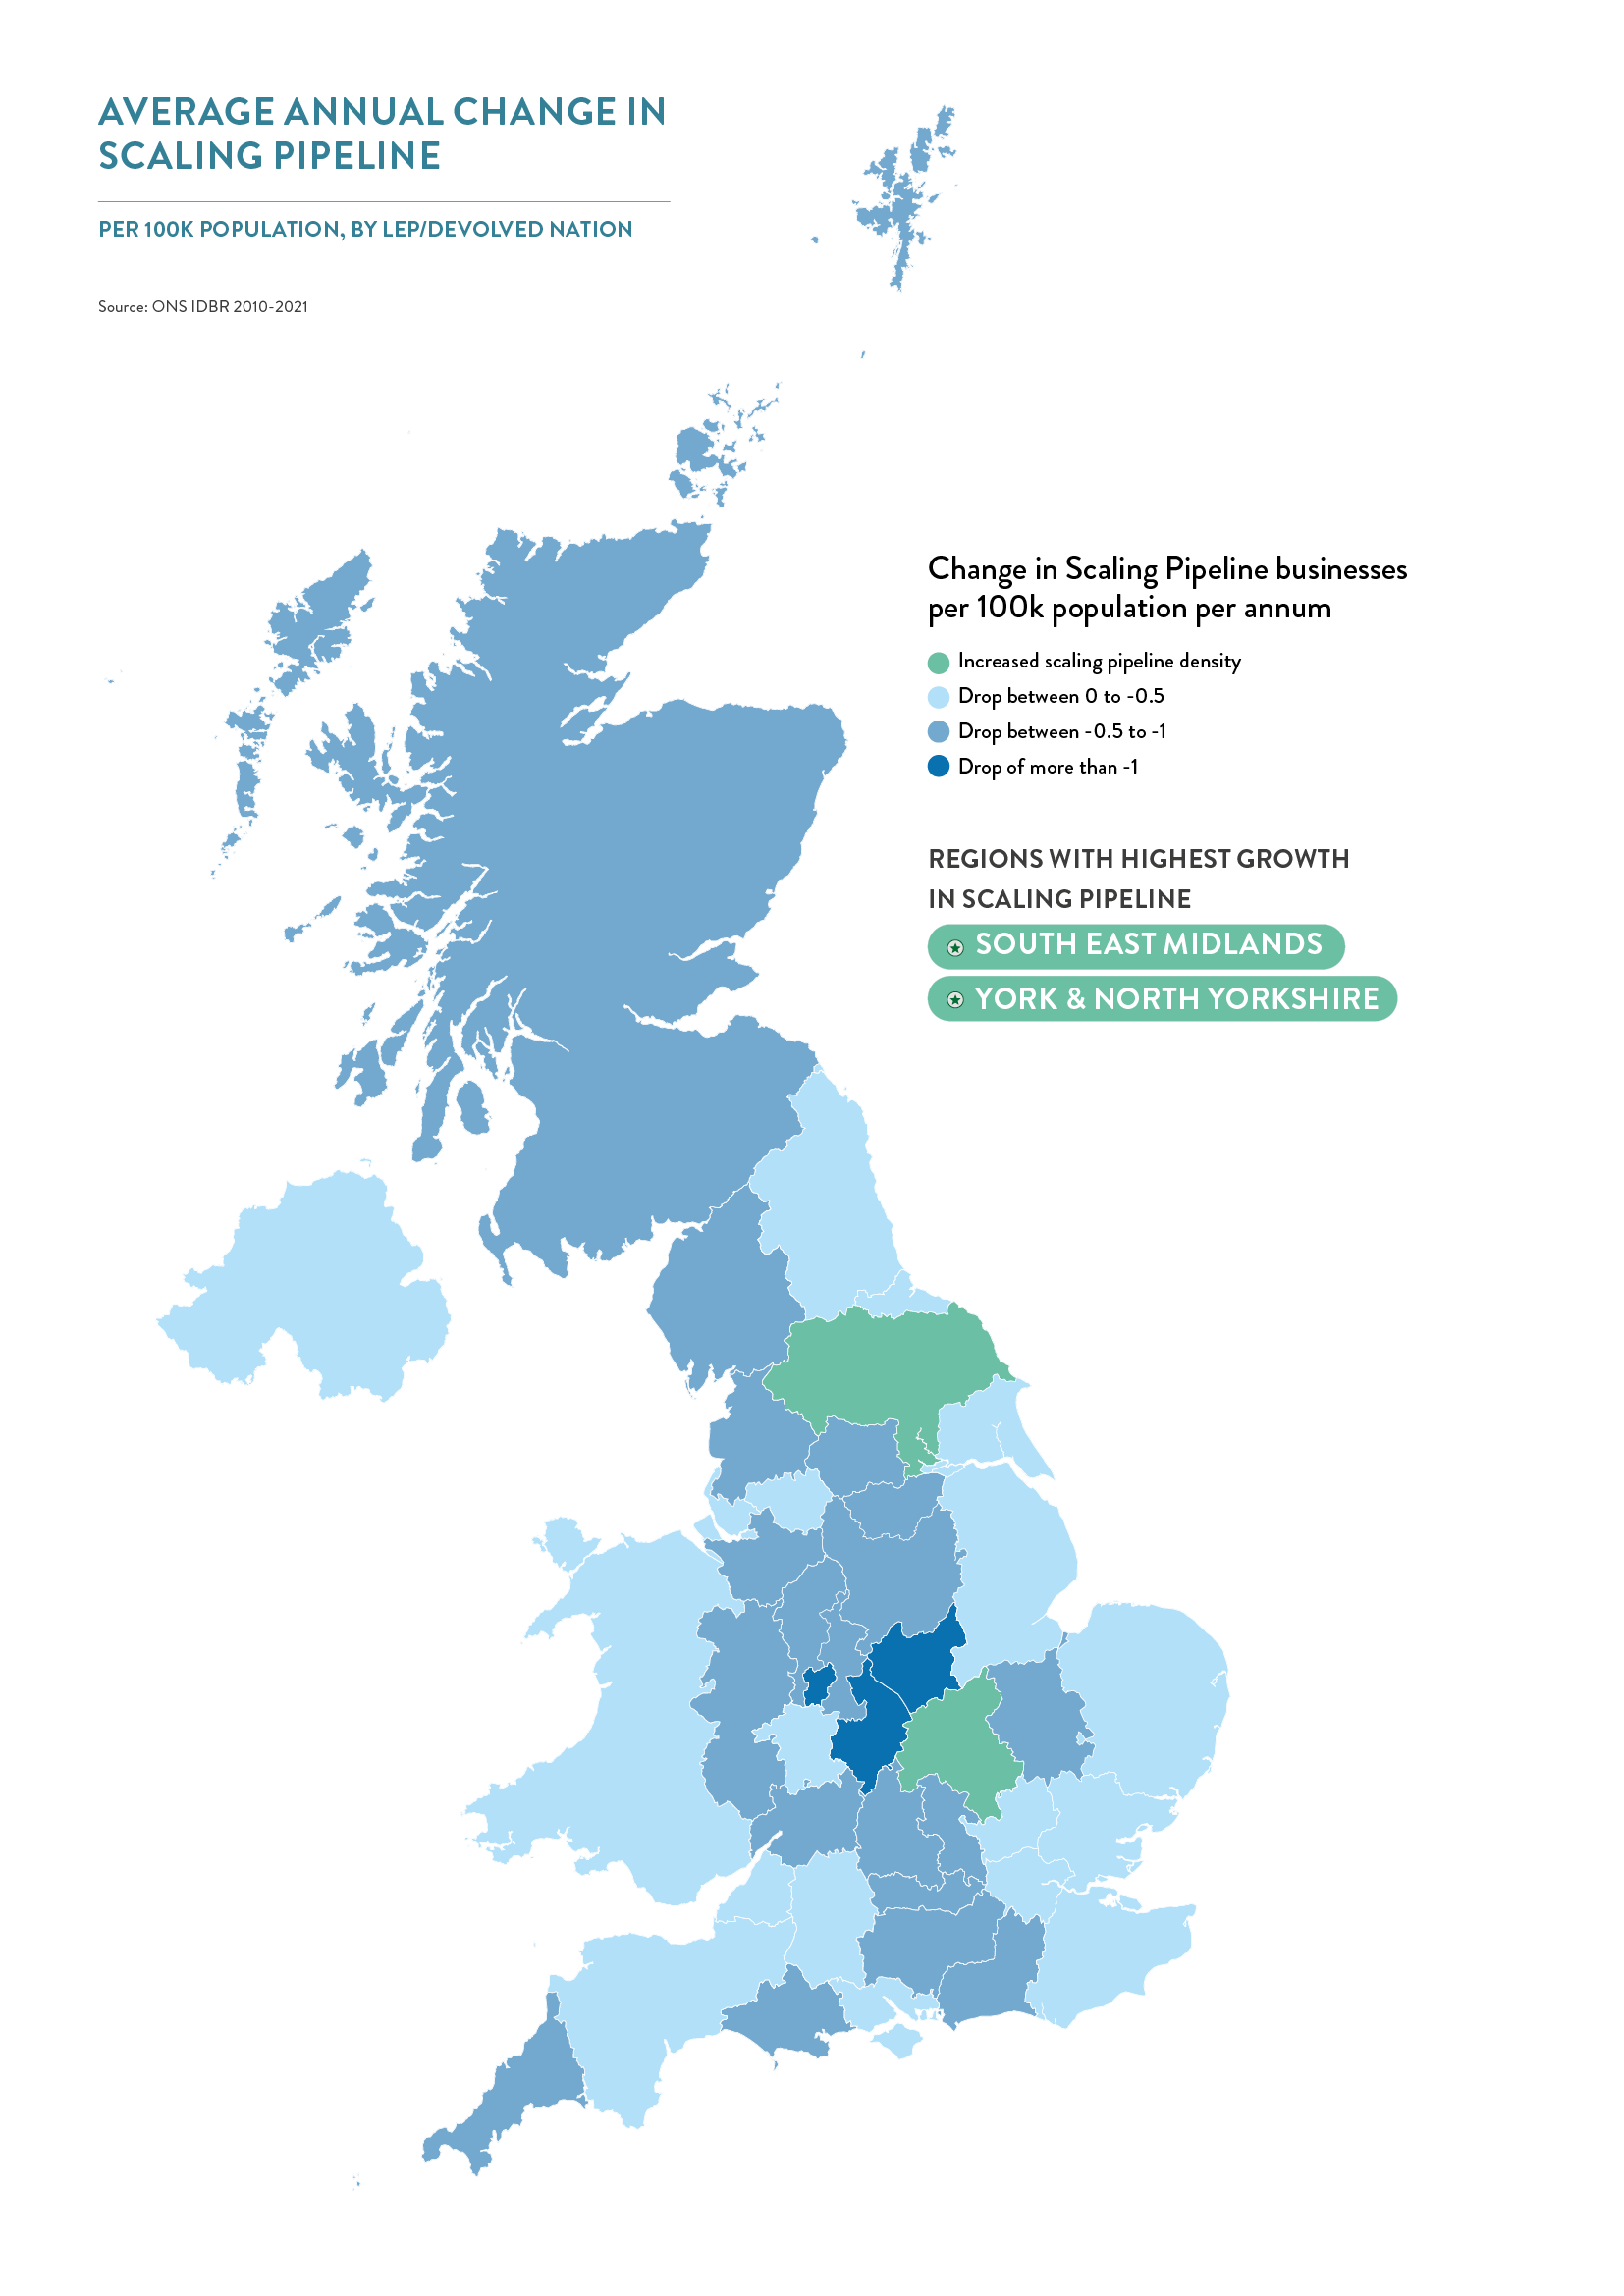
- South East Midlands, York & North Yorkshire and Hertfordshire are the only three areas that show growth in the scaling pipeline density in the seven year trend from 2014 to 2021. The latter two are even in the top 10 local areas for both scaleup and scaling pipeline density in 2021
- Nine English localities are in the top 10 local areas for both scaleup and scaling pipeline businesses per 100k population in 2021.
- Thames Valley Berkshire is the only area that, despite being densely populated for both scaleups and scaling pipeline businesses, has exhibited a significant decline in the average change in pipeline density since 2014.
Longer term growth trends in the scaling pipeline at an English locality / devolved nation level are illustrated on the map below. Areas of a brighter green exhibit higher growth and areas of blue show slower growth or decline in scaleup populations.
CONTENTS

Introduction 2023

Chapter 1 2023
The ScaleUp Business Landscape

Chapter 2 2023

Chapter 3 2023


Share