Explore the ScaleUp Annual Review 2023
Select a section to expand and explore this year's review..
CONTENTS

Introduction 2023

Chapter 1 2023
The ScaleUp Business Landscape

Chapter 2 2023

Chapter 3 2023
LOCAL ANALYSIS OF GROWTH IN SCALEUPS
Regions and devolved nations
- 64% of scaleups are located outside London and South East with a reasonable spread across all regions of England and Devolved nations.
- London, with the highest number and density of scaleups in 2021, also outshines other regions in terms of growth. It added an average of 1 scaleup per 100k population per annum since 2013.
- After London, Northern Ireland and Wales show the highest growth in scaleup density since 2013.
| English Region / Devolved Nation | No of scaleups – 2021 | Average growth in scaleup density (since monitoring began) | Scaleups per 100k – 2021 |
| East Midlands | 1,825 | -0.3 | 37.4 |
| East of England | 2,560 | 0.0 | 40.3 |
| London | 6,300 | 1.0 | 71.6 |
| North East | 870 | 0.1 | 32.9 |
| North West | 3,005 | 0.1 | 40.5 |
| Northern Ireland | 660 | 0.4 | 34.7 |
| Scotland | 1,770 | -0.1 | 32.3 |
| South East | 3,940 | -0.3 | 42.4 |
| South West | 2,295 | 0.0 | 40.2 |
| Wales | 1,035 | 0.4 | 33.3 |
| West Midlands | 2,050 | -1.0 | 34.4 |
| Yorkshire and The Humber | 2,100 | 0.0 | 38.3 |
DEVOLVED NATIONS DEEP DIVE
1. SCOTLAND
While there is a reasonable distribution of scaleups across the different regions of Scotland, the Glasgow and Edinburgh Regional Economic Partnerships (REPs) together contain 61% of Scottish scaleups. Aberdeen City & Shire and the Tay Cities are jointly the third biggest regions for scaleups. The South of Scotland has the fewest scaleups.
There is quite a broad variation in the composition of scaleups by turnover, employment or both. Ayrshire and the Highlands and Islands are the regions with the highest proportion scaling solely by turnover. Aberdeen City and Shire, Tay Cities and South Scotland have the greatest numbers of employment scaleups. One in four scaleups in the Forth Valley are growing by both employment and turnover – the highest proportion of this type of scaleup.
Scaleup Density per 100k population
Determining the density of scaleups against population provides insight into how different regions are performing against one another and over time. Scotland as a whole has a scaleup density of 32.3 per 100k population.
3 out of 8 REPs have a higher density than the national average – Aberdeen City & Shire (39 scaleups per 100k population), Edinburgh & South East (35) and Highlands and Islands (34). Glasgow City is on a par with Scotland as a whole. However Ayrshire (23), Tay Cities (24) and South of Scotland (26) each have significantly lower densities.
Forth Valley showed the highest growth in density since 2013 followed by Edinburgh.
| Regional Economic Partnerships | Scaleups 2021 | Average growth in scaleup density 2013-2021 | Scaleups per 100k pop – 2021 |
| Forth valley | 85 | 0.8 | 28 |
| Edinburgh & South East | 490 | 0.6 | 35 |
| Ayrshire | 85 | 0.3 | 23 |
| South of Scotland | 70 | 0.2 | 26 |
| Glasgow City | 595 | 0.1 | 32 |
| Tay Cities | 190 | -0.1 | 24 |
| Highlands and Islands | 170 | -0.9 | 34 |
| Aberdeen City & Shire | 190 | -2.9 | 39 |
| Total | 1,770 | -0.1 | 32.3 |
2. WALES
Wales had a total of 1,035 scaleups in 2021. When we map the 22 local authorities of Wales into four broad Welsh regions[2]., almost half of these scaleups are in the South East. North Wales and South West Wales each contain more than 20% of the total scaleups, whereas Mid-Wales has the fewest scaleups (6%).
Scaleup Density per 100k population
For Wales as a whole, the overall density of scaleups is 33.3 per 100k population in 2021; this is slightly higher than the overall density of Scotland (32.3) but lower than that of Northern Ireland (34.7) and England (44.1). The North Wales region comes up to the top in terms of scaleup density (35 scaleups per 100k population), followed by South East Wales (34).
With the exception of South West Wales scaleup density is increasing with average density in North Wales growing by 0.7 per 100k population per year and by 0.5 in South East Wales.
| Welsh Regions | Scaleups 2021 | Average growth in scaleup density 2013-2021 | Scaleups per 100k pop – 2021 |
| North Wales | 240 | 0.7 | 35 |
| South East Wales | 515 | 0.5 | 34 |
| Mid Wales | 65 | 0.4 | 32 |
| South West Wales | 215 | -0.1 | 31 |
| Total | 1035 | 0.4 | 33.3 |
3. NORTHERN IRELAND
Northern Ireland had a total of 660 scaleups in 2021. Among the 11 local government districts, a significant proportion of the total are clustered in Belfast (28%). The remaining 10 districts have scaleup businesses ranging between 5-11%, with highest in Newry Mourne and Down (11%), and least in Causeway Coast and Glens (~5%).
Scaleup Density per 100k population
While Northern Ireland has the fewest scaleups of the four nations of the UK, it nonetheless ranks only behind England with its density of 34.7 scaleups per 100k population.
Each of the 11 local government districts has seen variations in the last eight years in terms of scaleup density. In particular , Belfast has seen the highest average growth in scaleup density between 2013-2021, jumping from 39 scaleups per 100k population in 2013 to 54 in 2021. In contrast, although Mid Ulster’s scaleup density is higher than the national average of 35, it has also seen the biggest drop in scaleup density between 2013-2021 on average – from 60 in 2013 to 43 per 100k population in 2021. Apart from Belfast and Mid Ulster, Newry Mourne and Down also has a higher number of scaleups per 100k population (38) than the national average of 35.
| Local Government Districts | Scaleups 2021 | Average growth in scaleup density 2013-2021 | Scaleups per 100k pop – 2021 |
| Belfast | 185 | 1.9 | 53.6 |
| Ards and North Down | 45 | 1.8 | 27.5 |
| Mid and East Antrim | 40 | 1.3 | 28.8 |
| Antrim and Newtownabbey | 35 | 0.8 | 24.0 |
| Newry Mourne and Down | 70 | 0.2 | 38.4 |
| Armagh City, Banbridge and Craigavon | 55 | 0.1 | 25.1 |
| Fermanagh and Omagh | 35 | -0.6 | 29.9 |
| Causeway Coast and Glens | 30 | -0.9 | 21.2 |
| Derry City and Strabane | 50 | -0.9 | 33.1 |
| Lisburn and Castlereagh | 50 | -1.3 | 33.5 |
| Mid Ulster | 65 | -2.1 | 43.2 |
| Total | 660 | 0.2 | 34.7 |
COMBINED AUTHORITIES
There are ten combined authorities (CAs) in England, first of which – Greater Manchester – was formed in 2013. These are local government institutions which enable collaboration between councils[2].. The collective effort ensures that councils can take greater advantage of combined powers and resources.
For the first time this year, we have analysed the progress these CAs have made in the period they have existed.
- While there was a slowdown in 2021, 5 out of 10 CAs have shown positive growth in their scaleup density since 2013
| Combined Authority (CA) | Constituent Local Authorities | Year when CA was formed | Number of scaleups | Average growth in scaleup density (since monitoring began) | Scaleups per 100k – 2021 |
| North East (non-mayoral) | County Durham; Gateshead; South Tyneside; Sunderland | 2014 | 375 | 0.4 | 32.9 |
| Greater Manchester | Bolton; Bury; Oldham; Manchester; Rochdale; Salford; Stockport; Tameside; Trafford; Wigan | 2013 | 1,280 | 0.4 | 44.6 |
| Liverpool City Region | Halton; Knowsley; Liverpool; Sefton; St Helens; Wirral | 2014 | 530 | 0.4 | 34.2 |
| North of Tyne | Newcastle upon Tyne; North Tyneside; Northumberland | 2018 | 300 | 0.3 | 36.2 |
| West of England | Bath and North East Somerset; Bristol; South Gloucestershire | 2017 | 470 | 0.2 | 49.3 |
| South Yorkshire | Barnsley; Doncaster; Rotherham; Sheffield | 2014 | 440 | -0.1 | 32.0 |
| West Yorkshire | Bradford; Calderdale; Kirklees; Leeds; Wakefield | 2014 | 935 | -0.2 | 39.8 |
| Cambridgeshire and Peterborough | Cambridge; East Cambridgeshire; Fenland; Huntingdonshire; Peterborough; South Cambridgeshire | 2017 | 430 | -0.2 | 48.0 |
| Tees Valley | Darlington; Hartlepool
Stockton-on-Tees (north Tees); Stockton-on-Tees (south Tees); Middlesbrough; Redcar and Cleveland |
2016 | 195 | -0.5 | 28.8 |
| West Midlands | Birmingham; Coventry; Dudley; Sandwell; Solihull; Walsall; Wolverhampton | 2016 | 925 | -1.0 | 31.7 |
LOCALITIES
According to our research, enabling scaleups and maintaining a consistent healthy pipeline of scaling businesses is key to levelling up and enhancing prosperity across the UK.
In the following section, we assess the development in local scaleup dynamics during 2021. We recognise that the UK local governance ecosystem is continuously evolving, however, for this year’s report we have used the boundaries of the 38 English Local Enterprise Partnerships (LEP) as the basis of local analysis in order to ensure that we are able to look at the entire UK ecosystem through comparable local units.
SCALEUP TRENDS
SCALEUP DENSITY PER 100K POPULATION
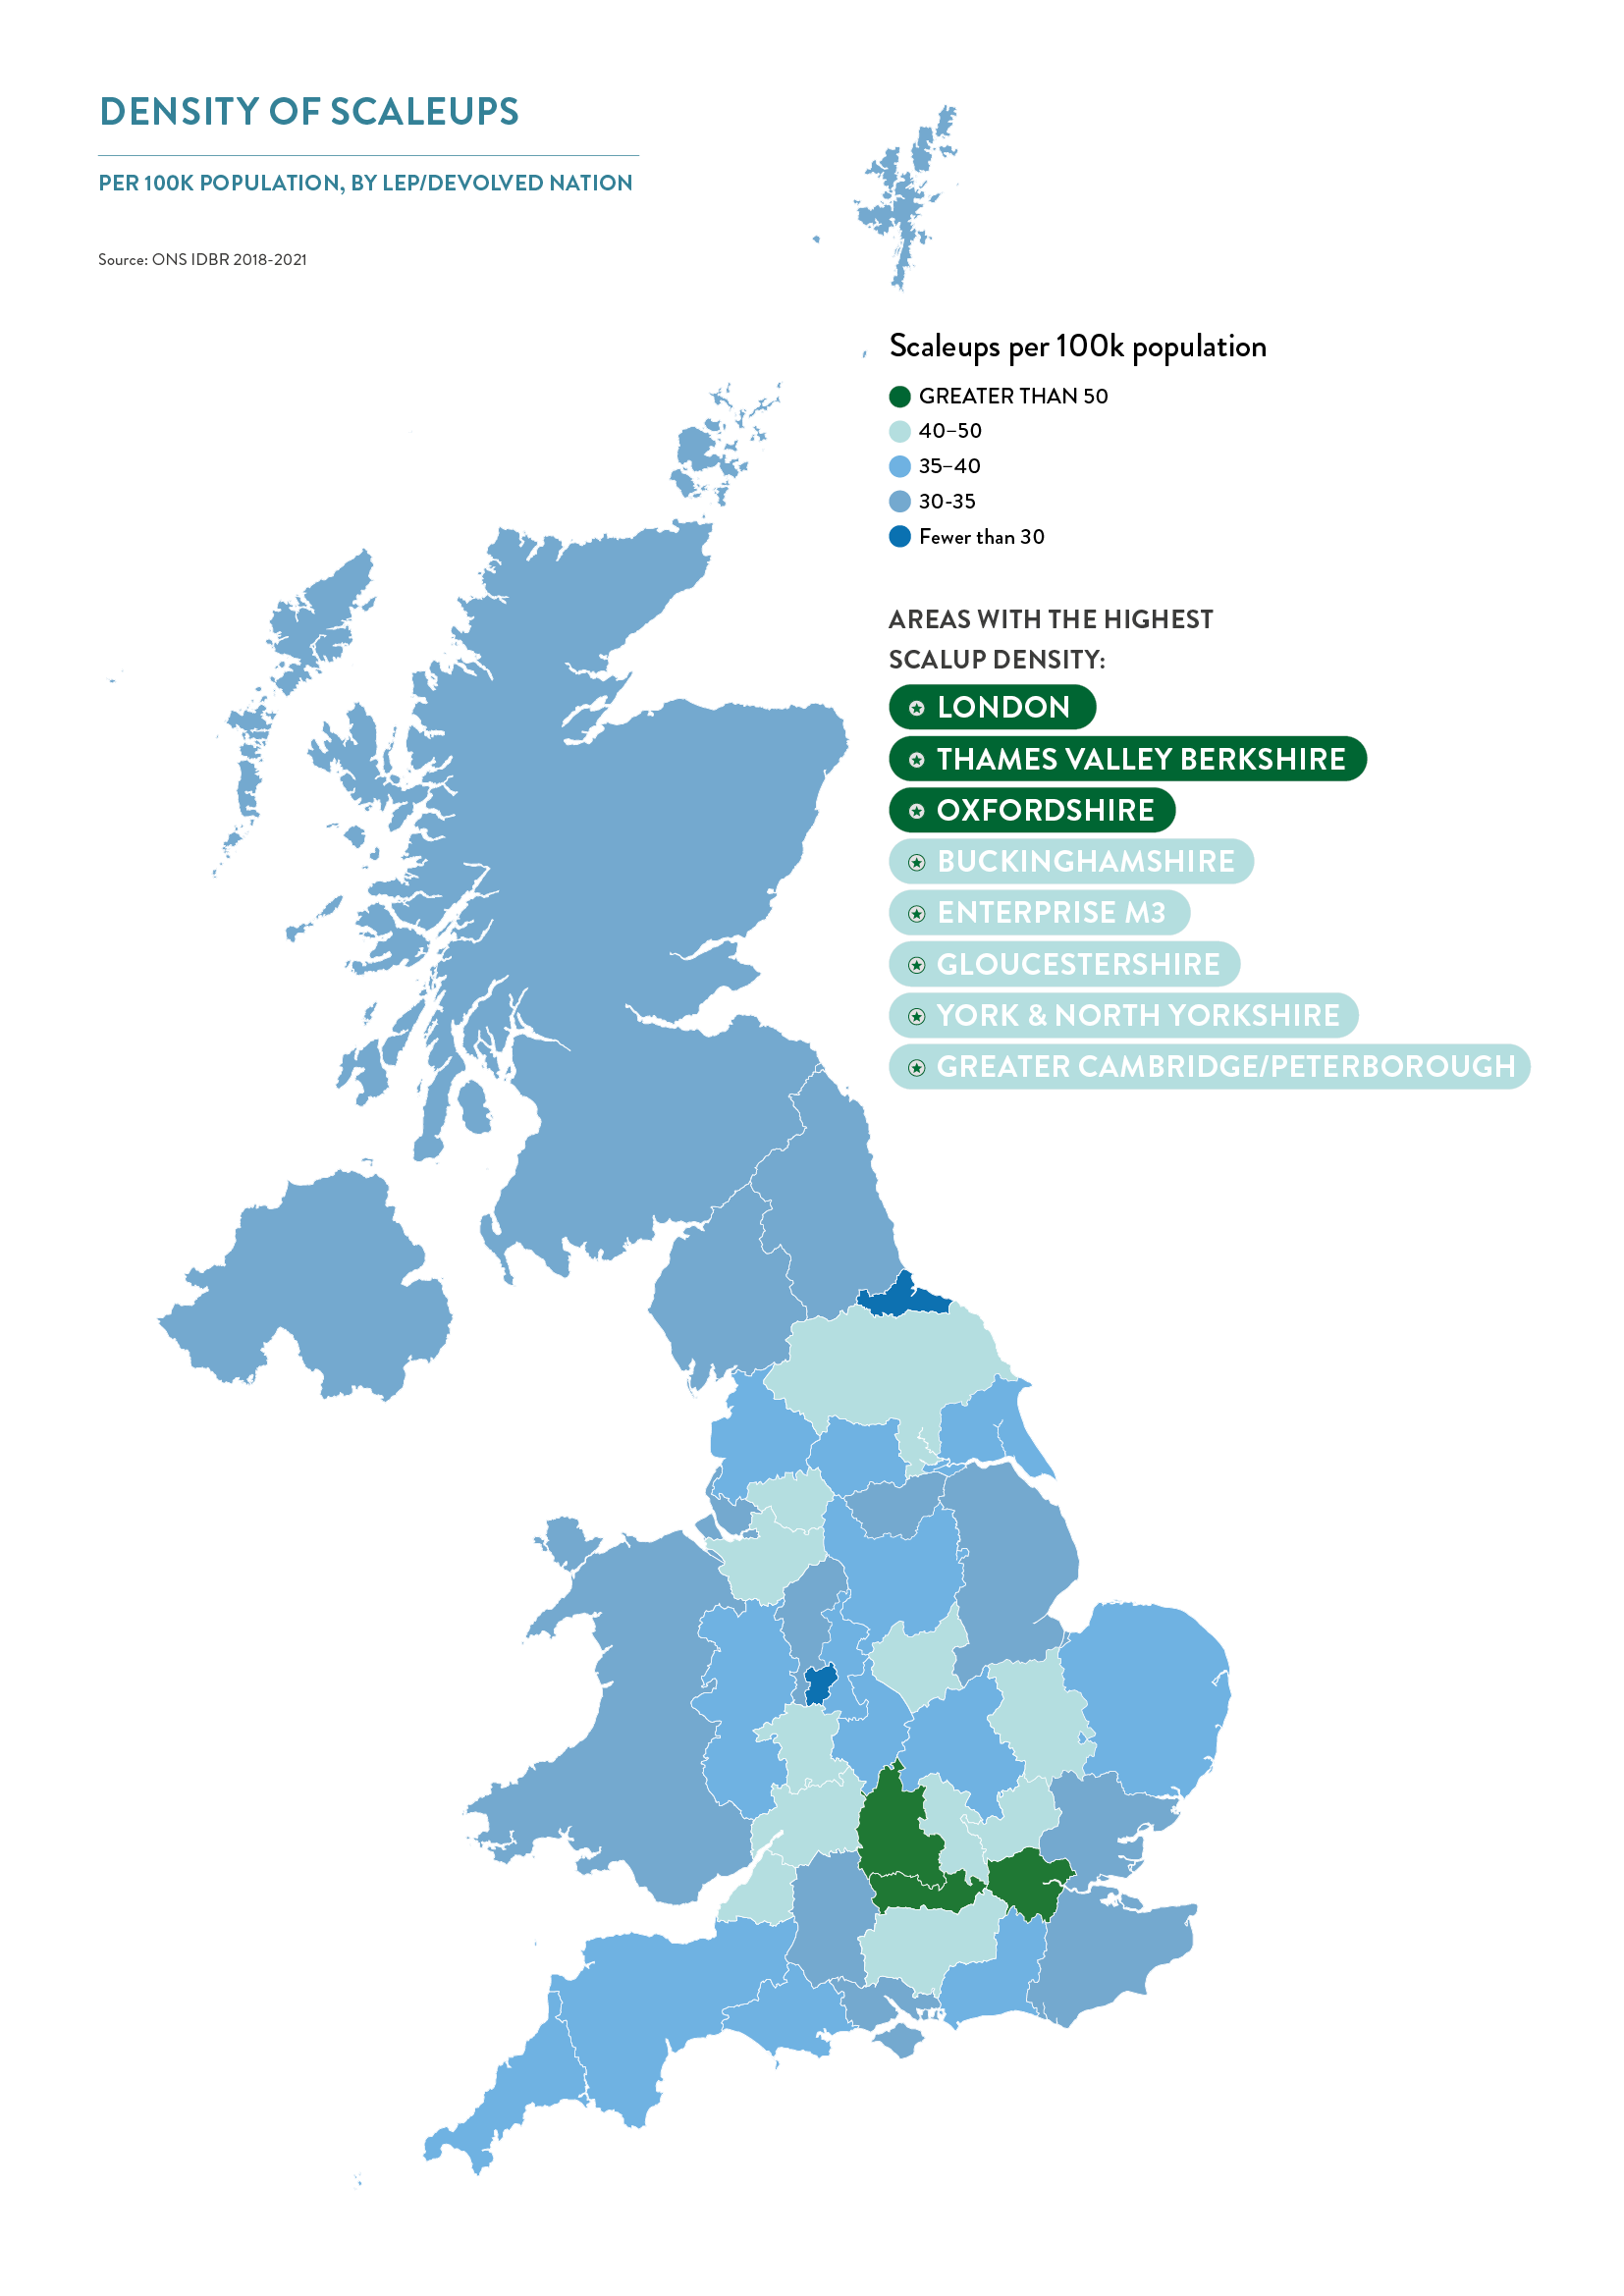
The map below shows the variation in the absolute number of scaleups, adjusted for population, indicating areas with particularly high density such as London (71.6 scaleups per 100k population) and Thames Valley Berkshire (57.9), as well as areas with lower densities of scaleups, such as Tees Valley (28.8).
Scaleups per 100k population – 2021
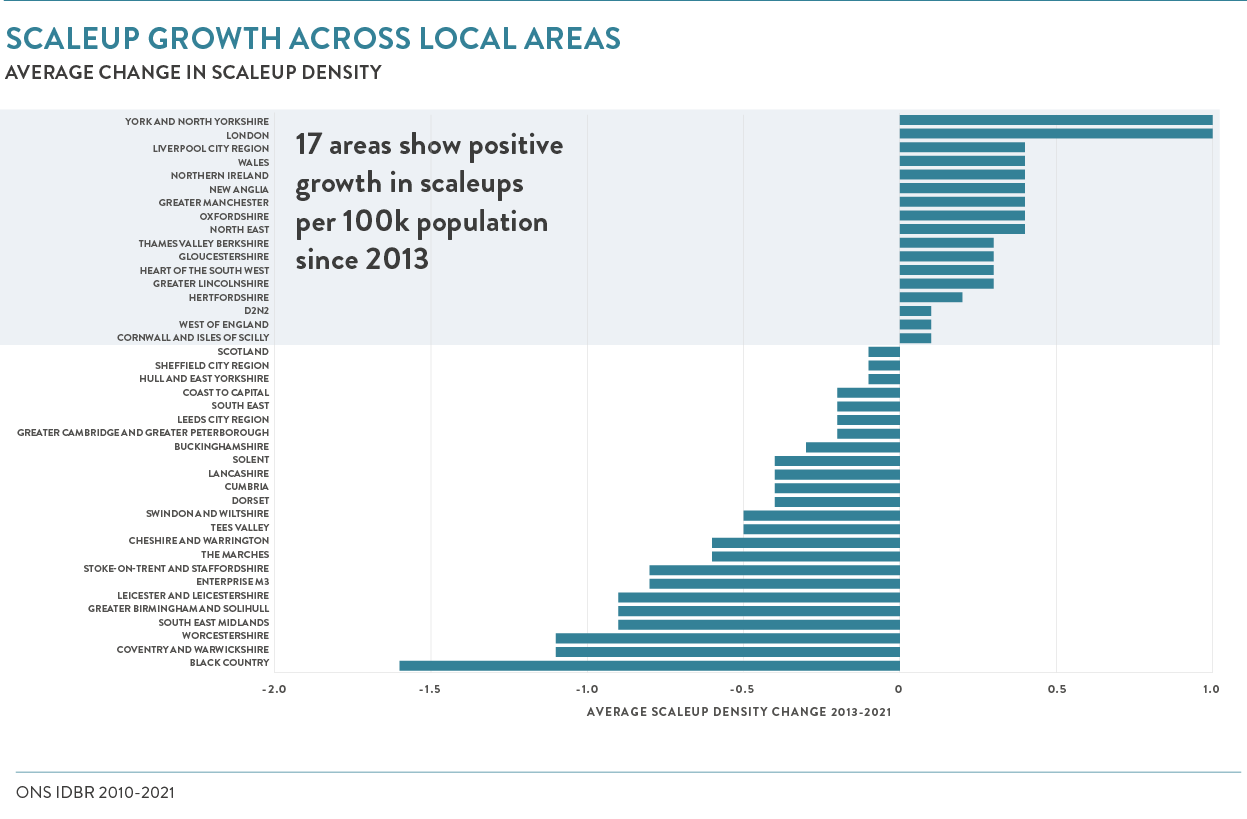
SCALEUP GROWTH ACROSS LOCAL AREAS
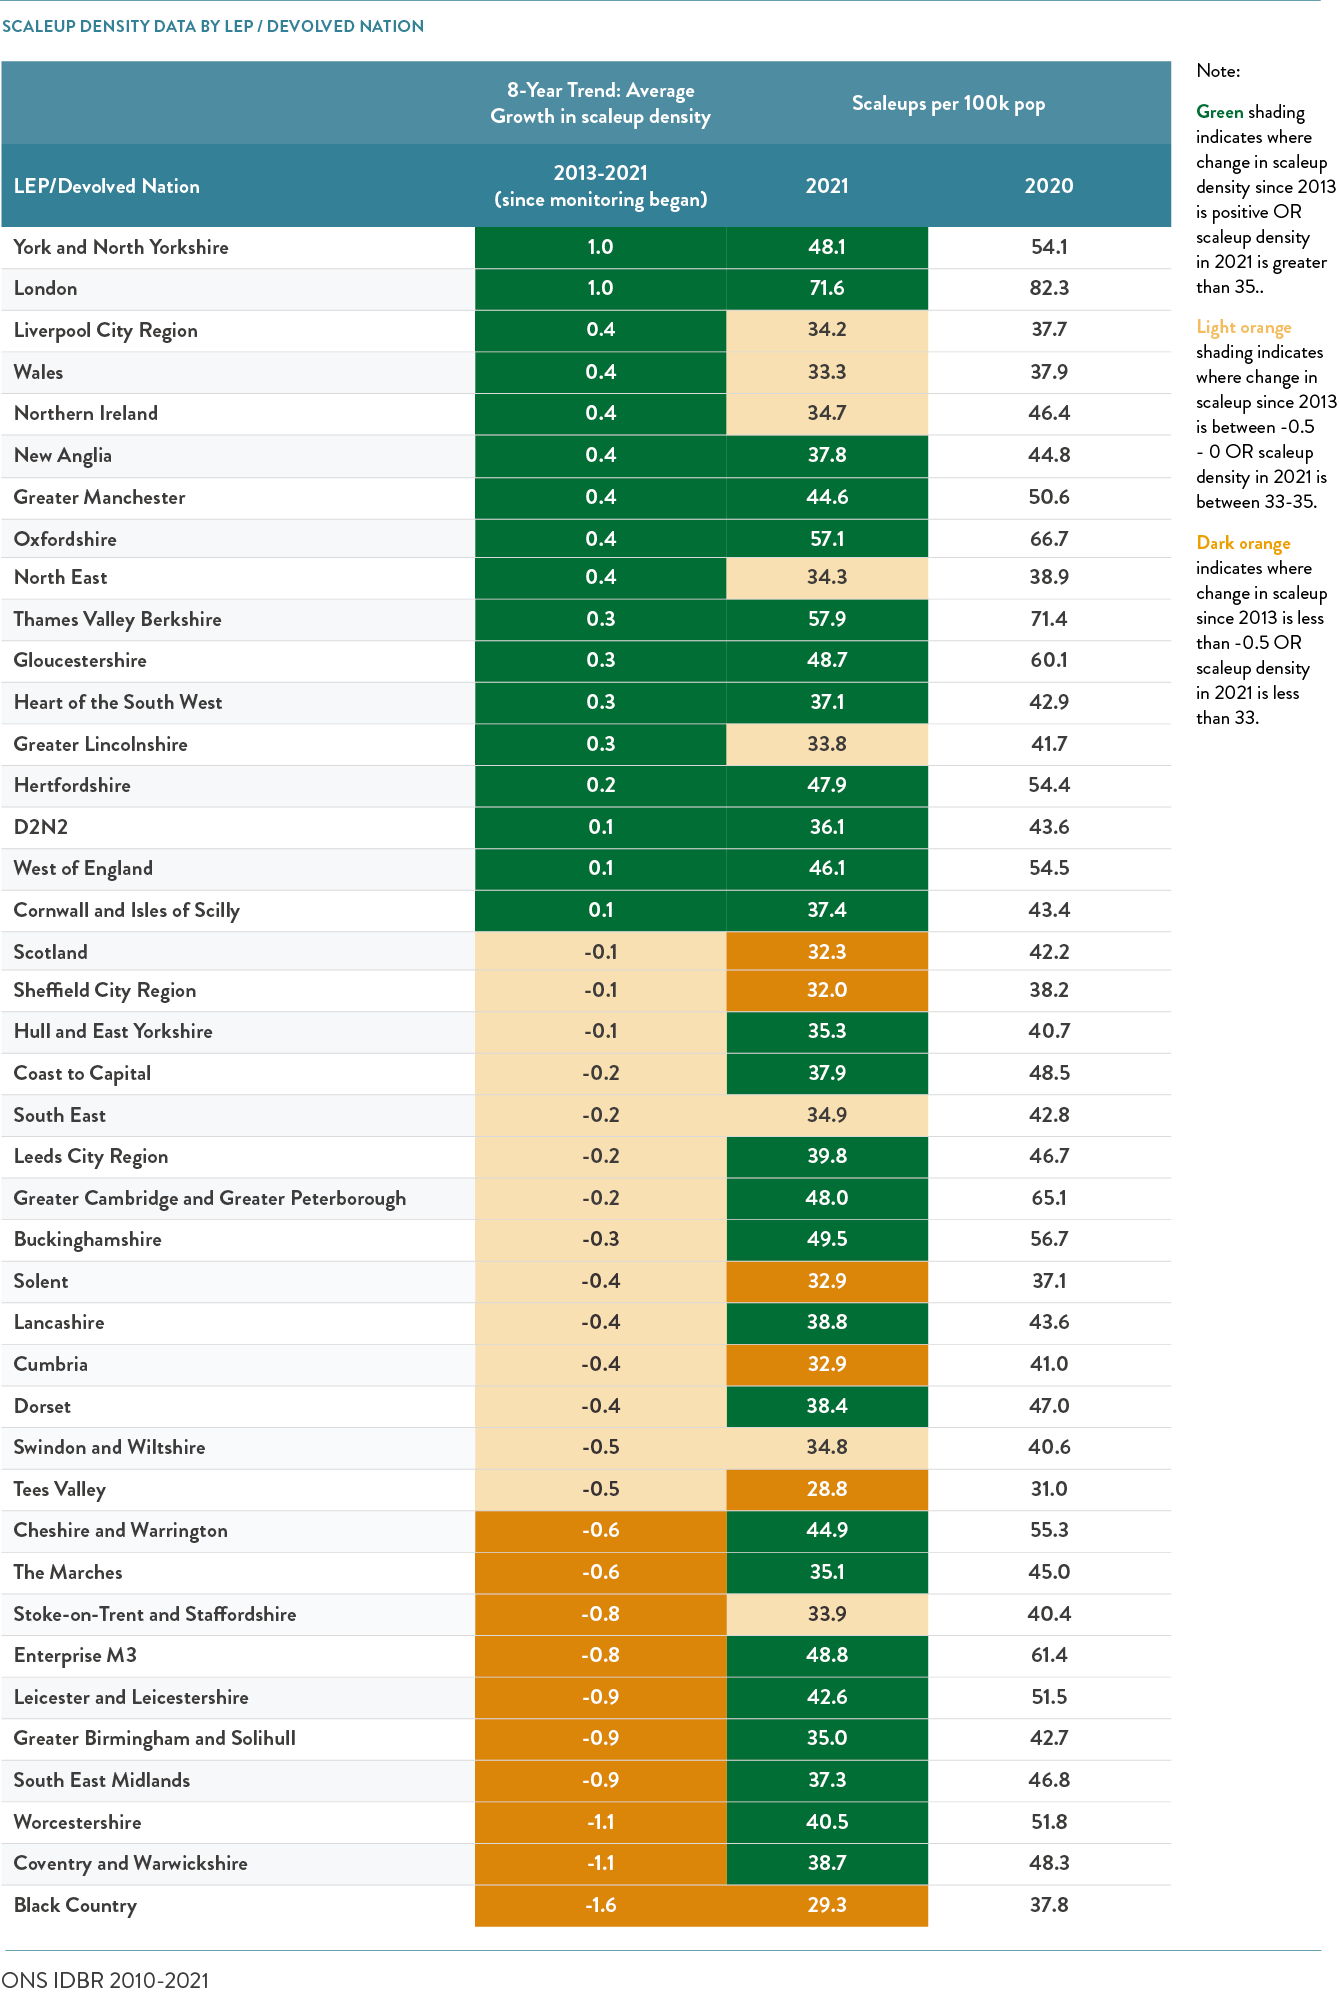
Across the three devolved nations, 38 English localities and at local authority level, we looked at eight-year cumulative change in scaleup density. While there is an overall slowdown across the UK, some regions are clearly more impacted by it.
- Wales, Northern Ireland and 15 of the 38 English localities achieved positive annual growth in scaleup per 100,000 of population between 2013 and 2021.
- In the latest year of analysis, between 2020 and 2021, all regions and devolved nations saw a decline in the scaleup density.
- Tees Valley and the Black Country remain most challenged in terms of scaleup density in 2021, with less than 30 scaleups per 100k population, and they have seen a decline in scaleup density since 2013.
TOP LOCAL AREAS BY PATTERN OF GROWTH
Scaleups growing by turnover:
| Top 5 English localities / Devolved nation by 2021 turnover scaleups per 100k | Top 5 English localities / Devolved nation by change in turnover scaleup density since 2013 | |
| London | London | |
| Oxfordshire | York and North Yorkshire | |
| Thames Valley Berkshire | Oxfordshire | |
| Enterprise M3 | Liverpool City Region | |
| Buckinghamshire | Greater Manchester |
Scaleups growing by employment:
| Top English localities / Devolved nation by 2021 employment scaleups per 100k | Top English localities / Devolved nation by change in employment scaleup density since 2013 | |
| London | Greater Lincolnshire | |
| Thames Valley Berkshire | York and North Yorkshire | |
| Oxfordshire | Gloucestershire | |
| West of England | Northern Ireland | |
| Cheshire and Warrington | Wales |
Local Authority Picture
The number of scaleups per 100,000 of population varies widely among local authorities. The figure below plots the density of employment and turnover scaleups by local authority against the growth rate.
The biggest change can be seen in the median growth per annum for turnover scaleups which dropped from 1.1 to -0.1.
City level analysis
We also looked at the major urban centres across the nation to understand their scaleup landscape. The top 5 cities outside of London by number of scaleups in 2021 were – Leeds, Manchester, Birmingham, Glasgow and Edinburgh. We will continue to examine this in greater detail to further dissect the growth in these cities that has happened over the years.
CONTENTS

Introduction 2023

Chapter 1 2023
The ScaleUp Business Landscape

Chapter 2 2023

Chapter 3 2023


Share