Explore the ScaleUp Annual Review 2022
Select a section to expand and explore this year's review..
CONTENTS

Introduction 2022

Chapter 1 2022
The ScaleUp Business Landscape

Chapter 2 2022
Leading Programmes Breaking Down the Barriers for Scaleups

Chapter 3 2022
The Local Scaleup Ecosystem

Chapter 4 2022
The Policy Landscape

Chapter 5 2022
Looking forward

Annexes 2022

SCALEUP STORIES 2022
LOCAL ANALYSIS OF GROWTH IN SCALEUPS
As evidence from the ScaleUp Institute has shown scaleups are an important driver of local economic performance and enabling scaleups and scaling businesses to continue to grow is a priority “primary directive” if we are to Level Up and enhance prosperity across the UK.
As we assess the development across 2020 in local scaleup dynamics we see an overall slow down in scaleup growth in many localities and continuing regional disparities.
SCALEUP TRENDS
SCALEUP DENSITY PER 100K POPULATION
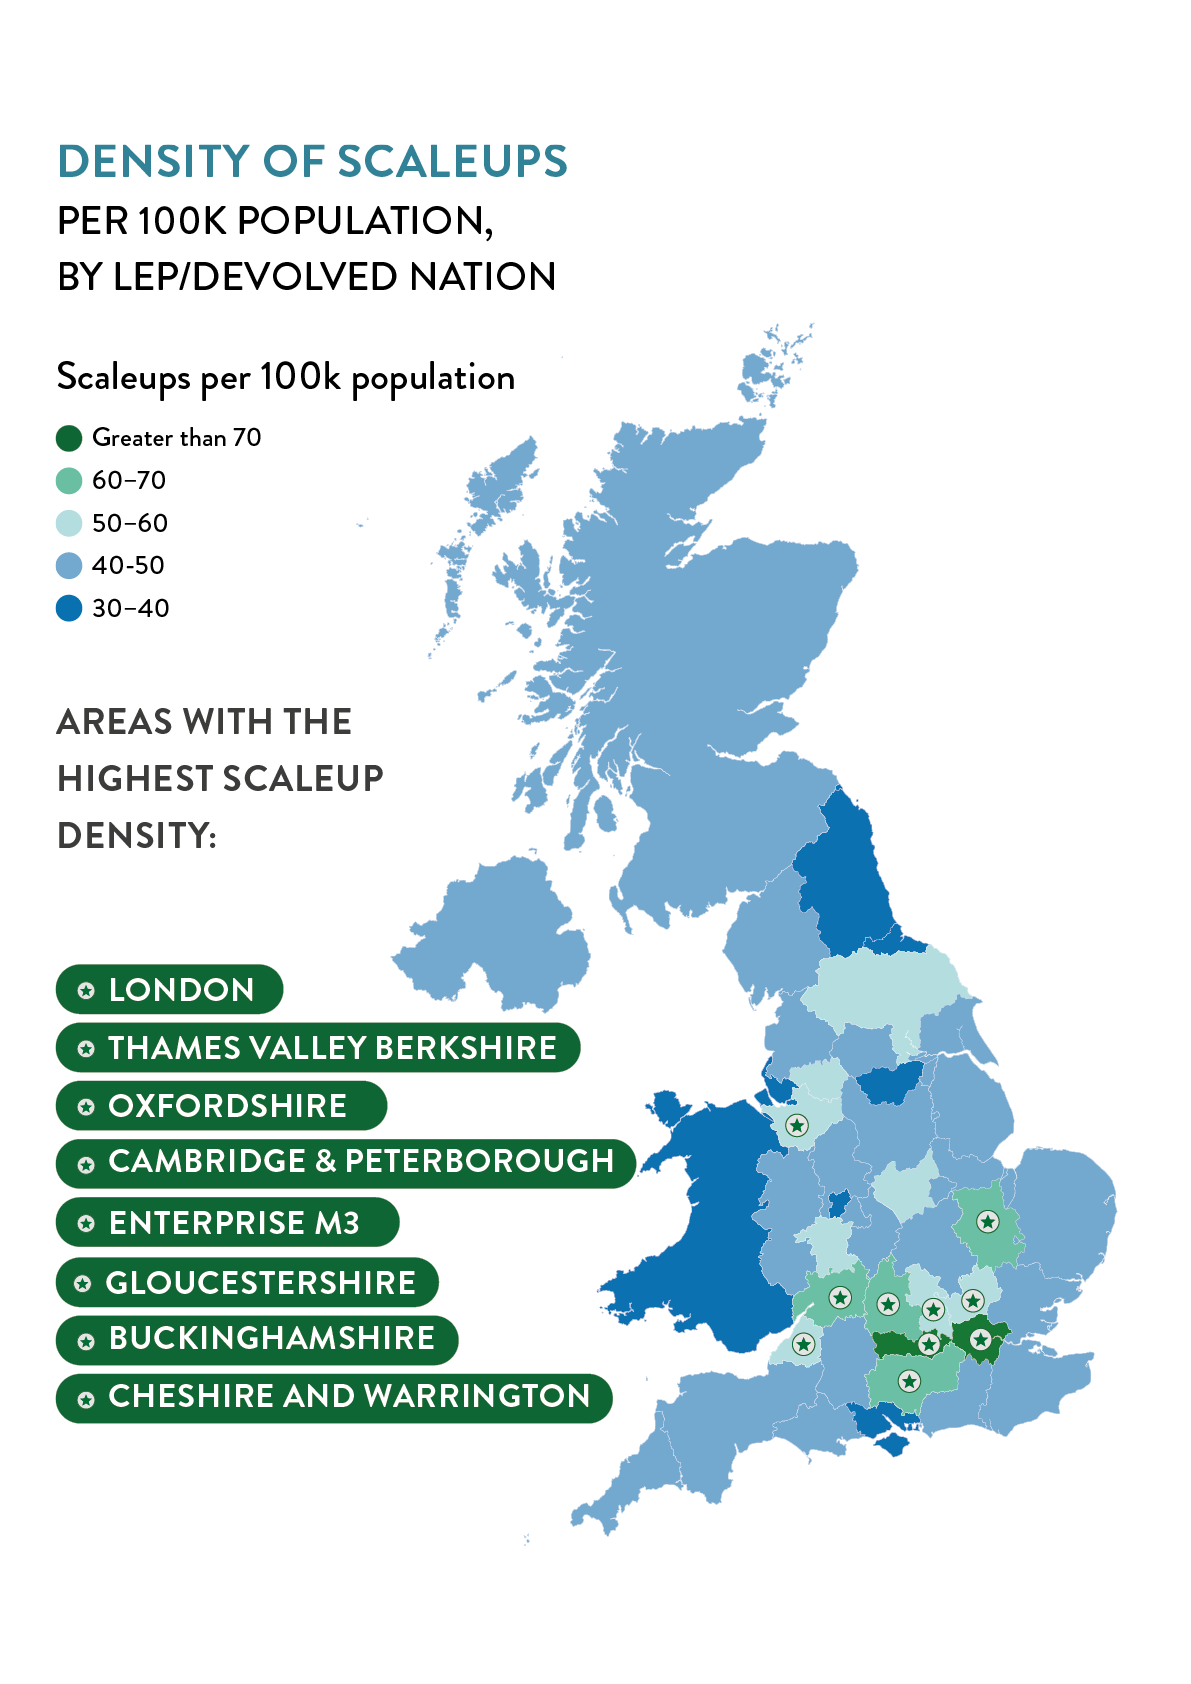
The map below shows the variation in the absolute number of scaleups, adjusted for population. Indicating areas with particularly high density, for example in London (82.3 scaleups per 100k population) and Thames Valley Berkshire (71.4), and areas with lower densities of scaleups, such as Tees Valley (31.0).
 SCALEUP GROWTH ACROSS LOCAL AREAS
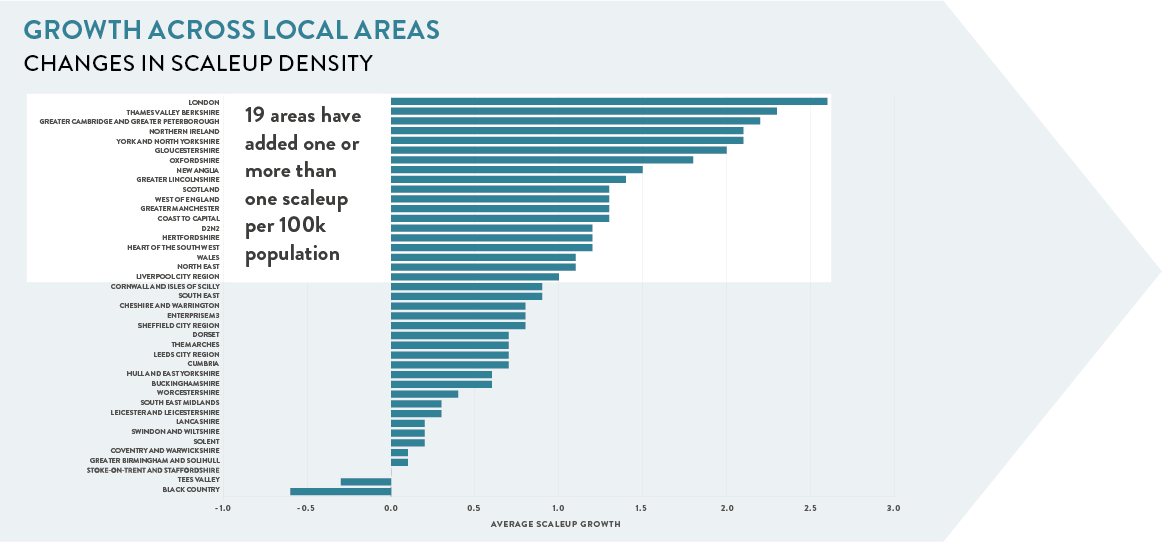
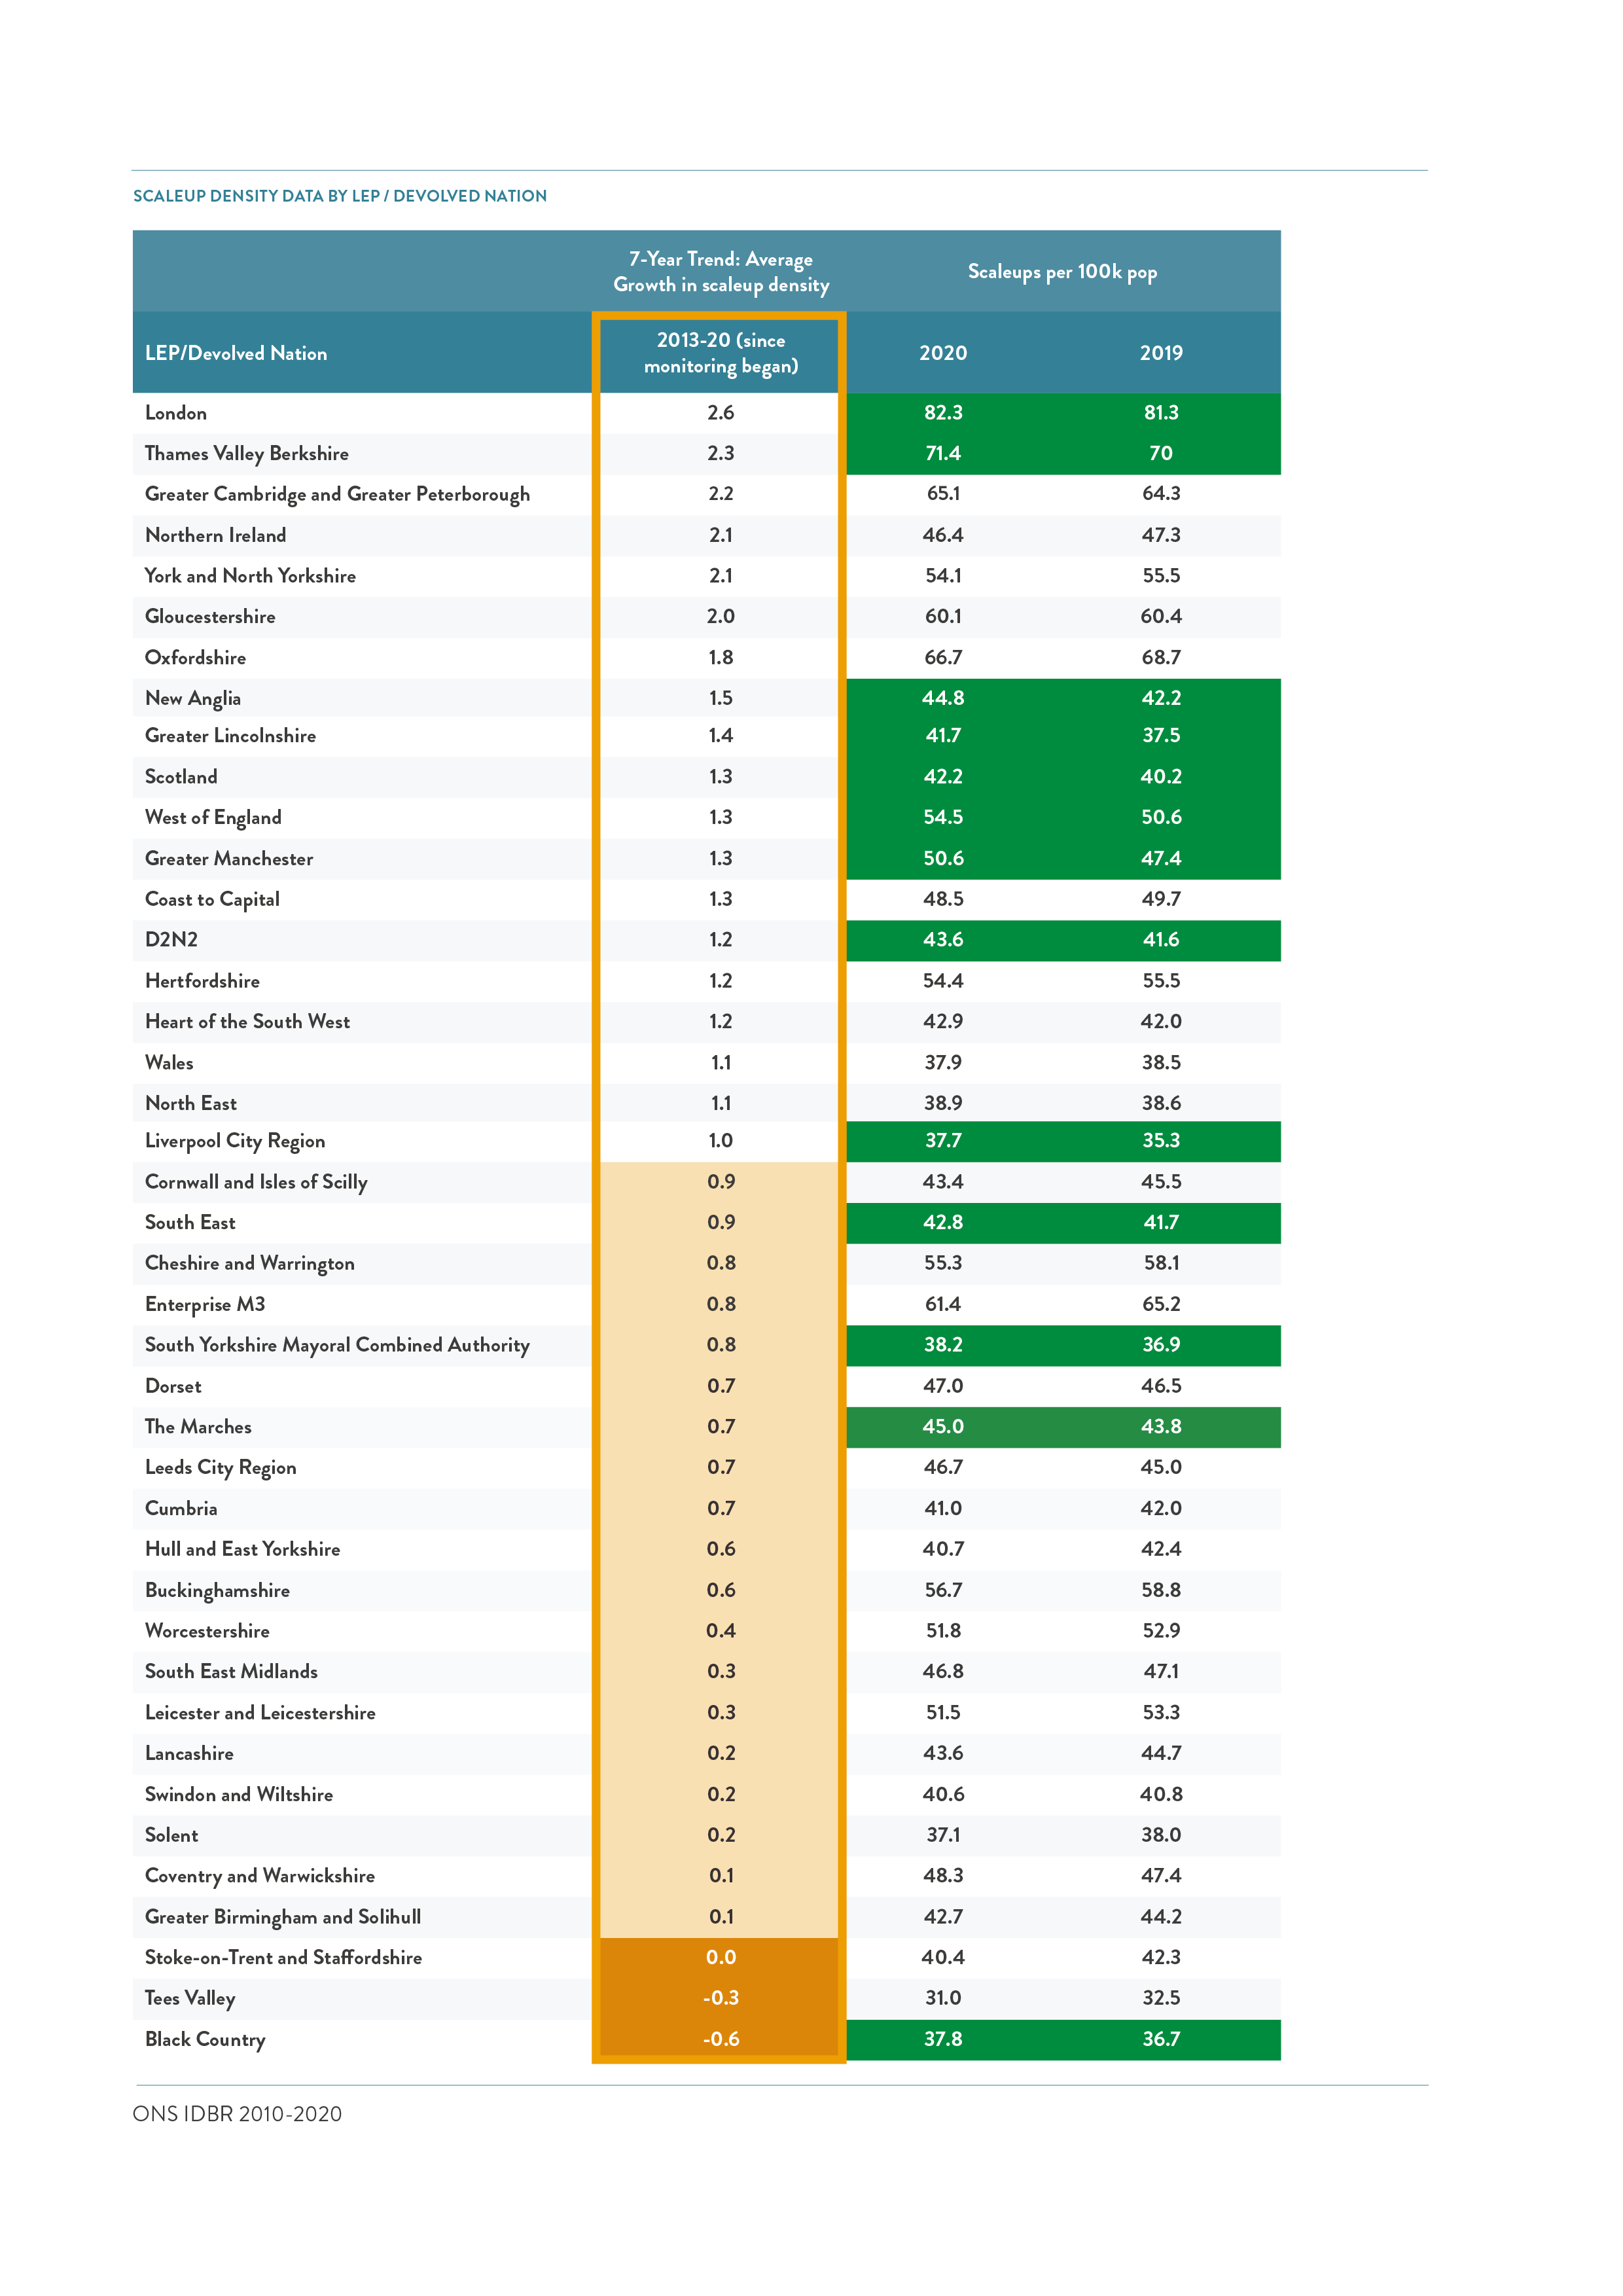
Across the 3 devolved nations, 38 English LEPs and at local authority level, we look at 7-year cumulative change in scaleup density. While the scaleup density for the UK overall seems stable in the last 3 periods of analysis, there exist significant differences in how the local areas are changing over time.
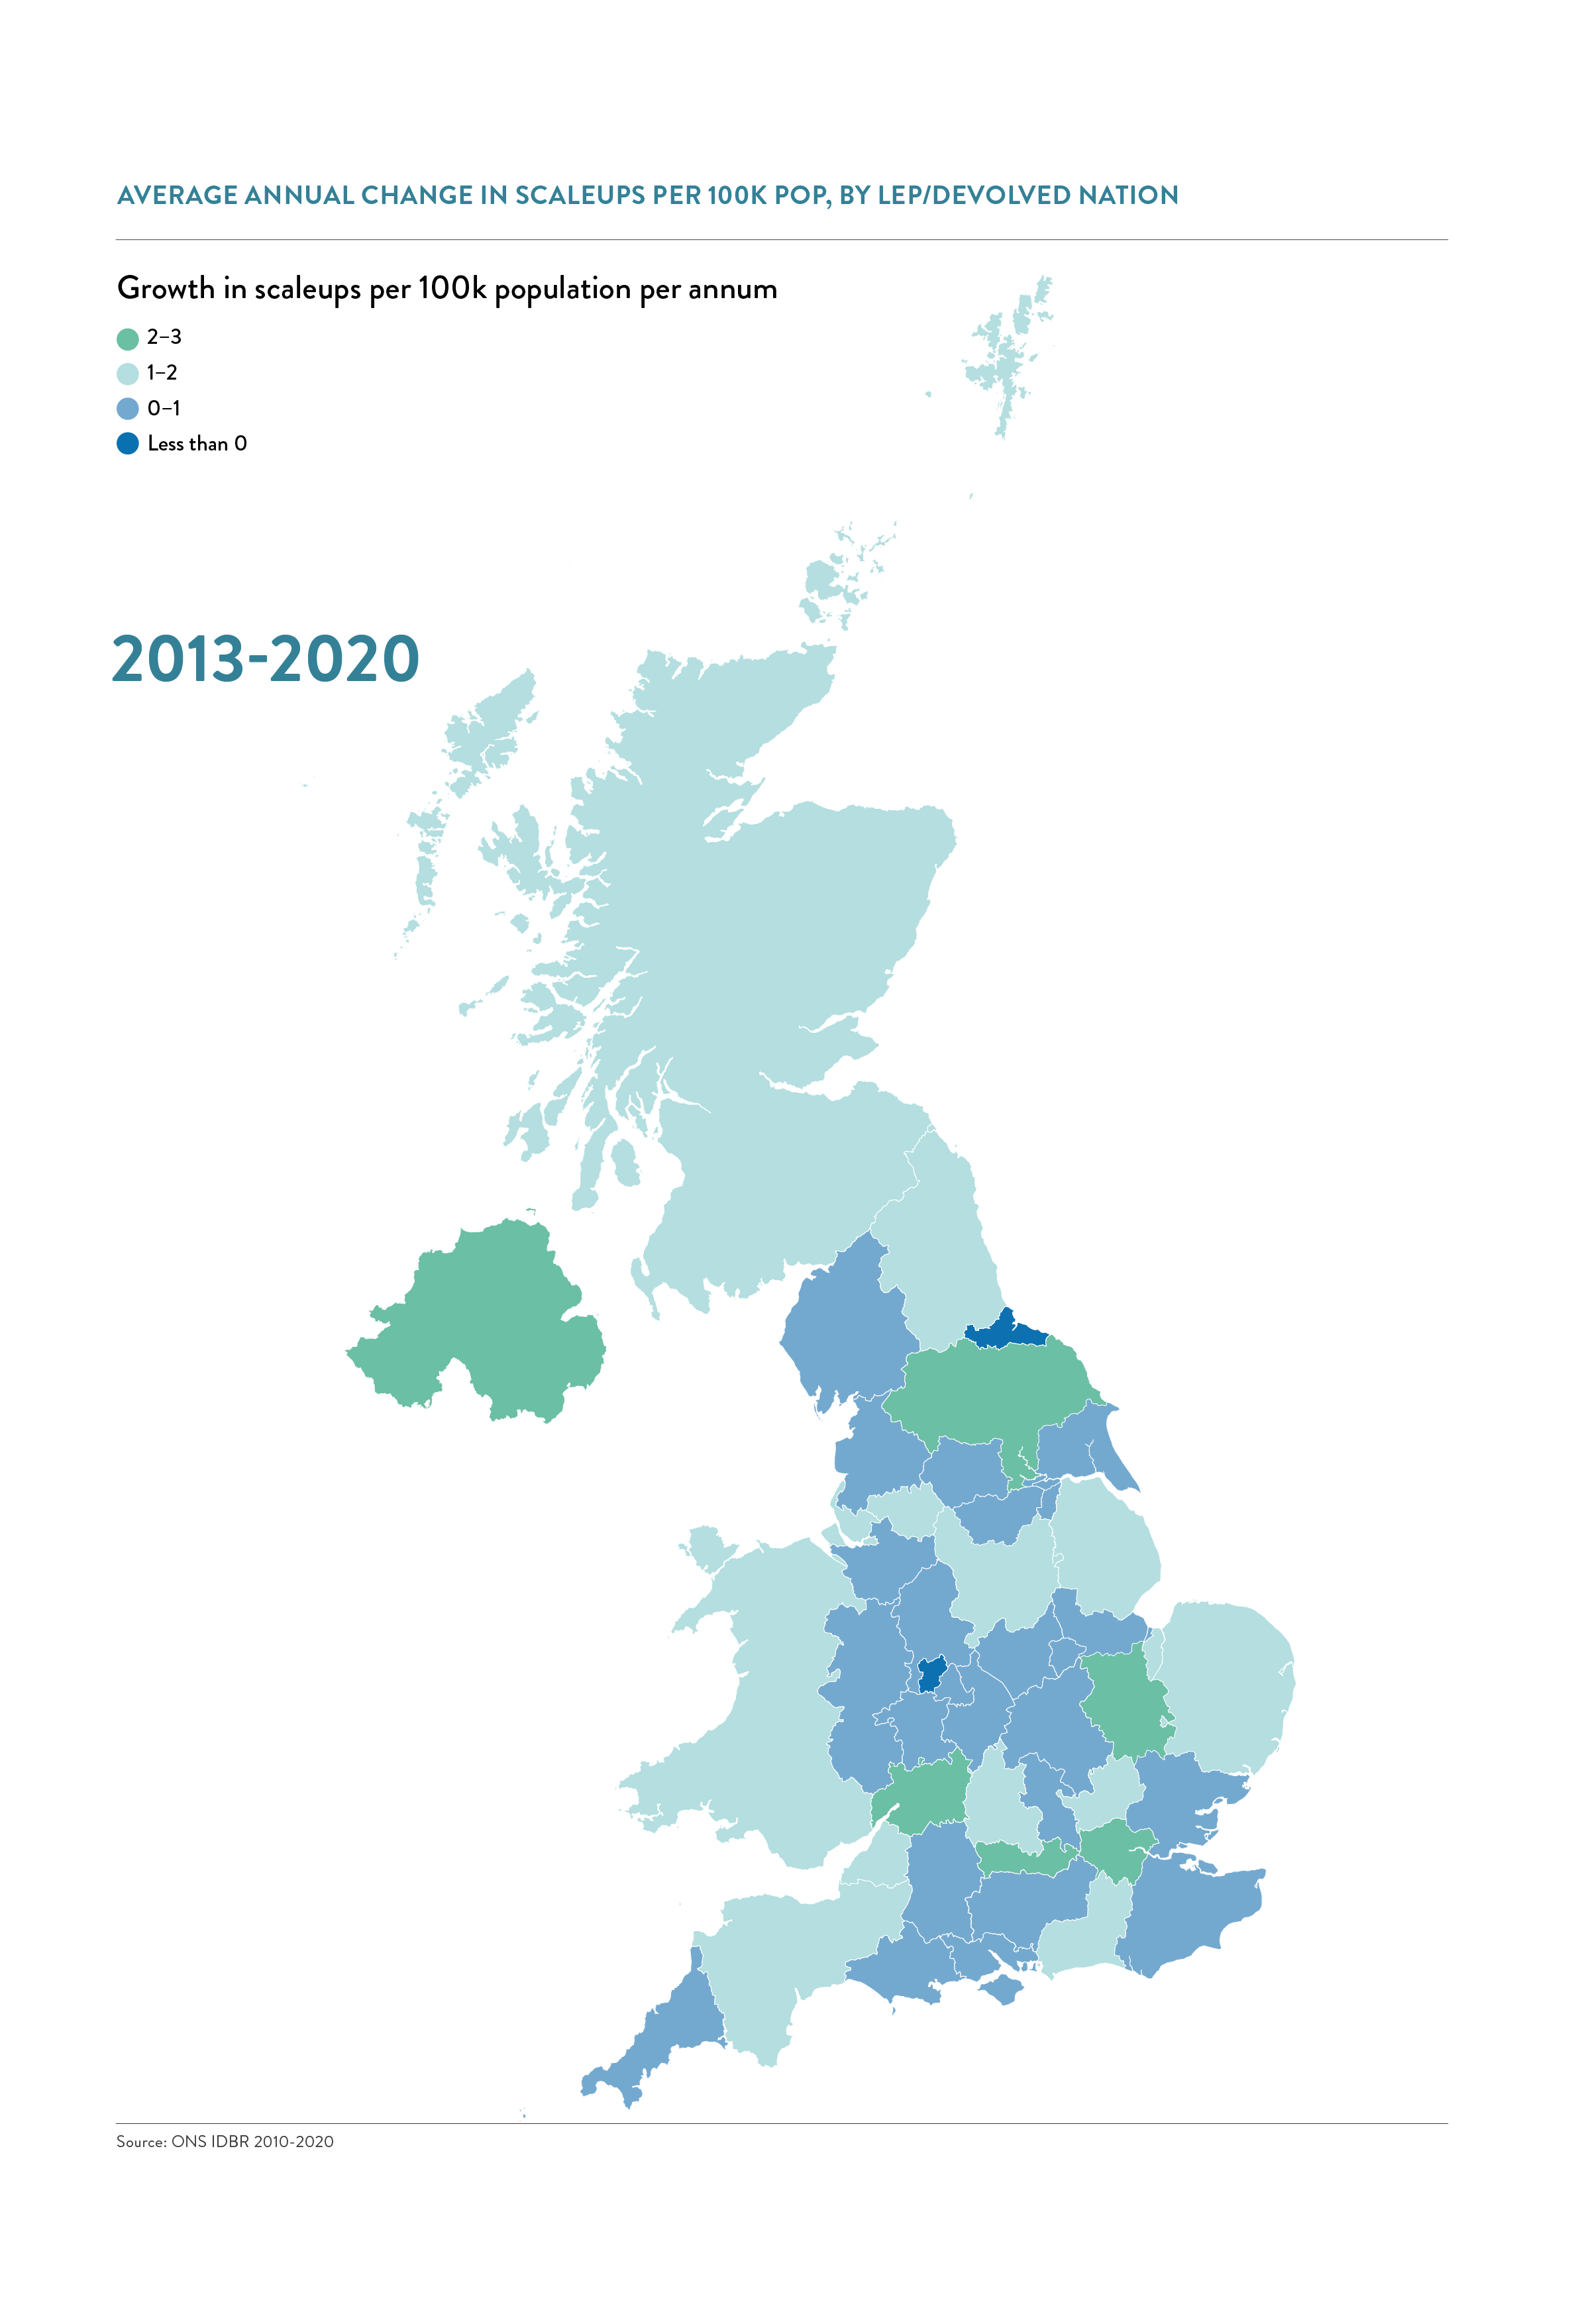
- All 3 devolved nations and 16 of the 38 LEPs have achieved annual growth of more than one scaleup per 100,000 of population between 2013 and 2020.
- In the latest year of analysis, between 2019 and 2020, however, we see 12 LEPs and 1 devolved nation (Scotland) achieved growth of more than one scaleup per 100,000 of population.
- 3 areas, Tees Valley, the Black Country, and Stoke-on-Trent & Staffordshire, remain most challenged in terms of overall scaleup growth despite some movement in recent years.
Note:
- Green shading indicates where overall density has increased between 2019 and 2020.
- Light orange shading indicates areas which have average growth of less than 1 scaleup per 100k population between 2013-2020
- Dark orange indicates areas which have average growth of 0 or less than 0 scaleup per 100k population between 2013-2020
SCALEUP DENSITY TRENDS OVER TIME
UK Nations
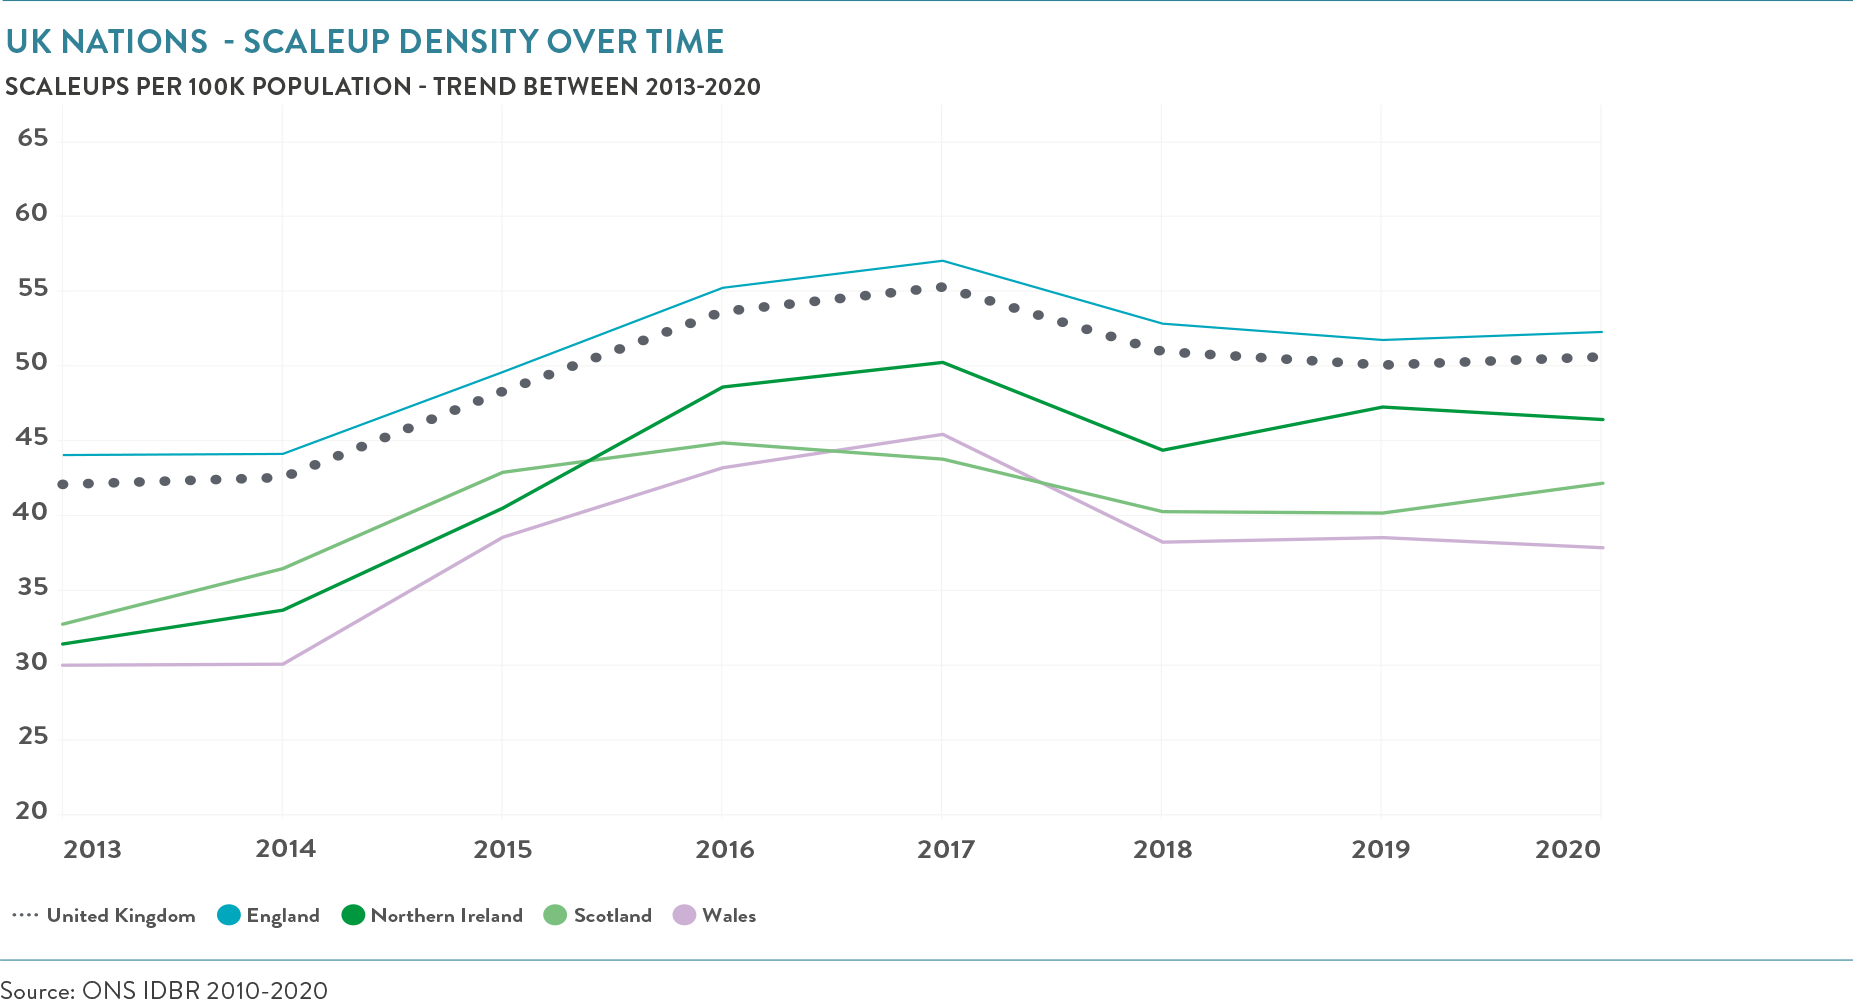
Density of scaleups has increased overall across the UK and in each nation since tracking began. England has the highest density, now 52.28 scaleups per 100k population, but Northern Ireland has shown the highest overall increase in scaleup density (+15 scaleups per 100k population) amongst the UK’s Nations.
English Regions
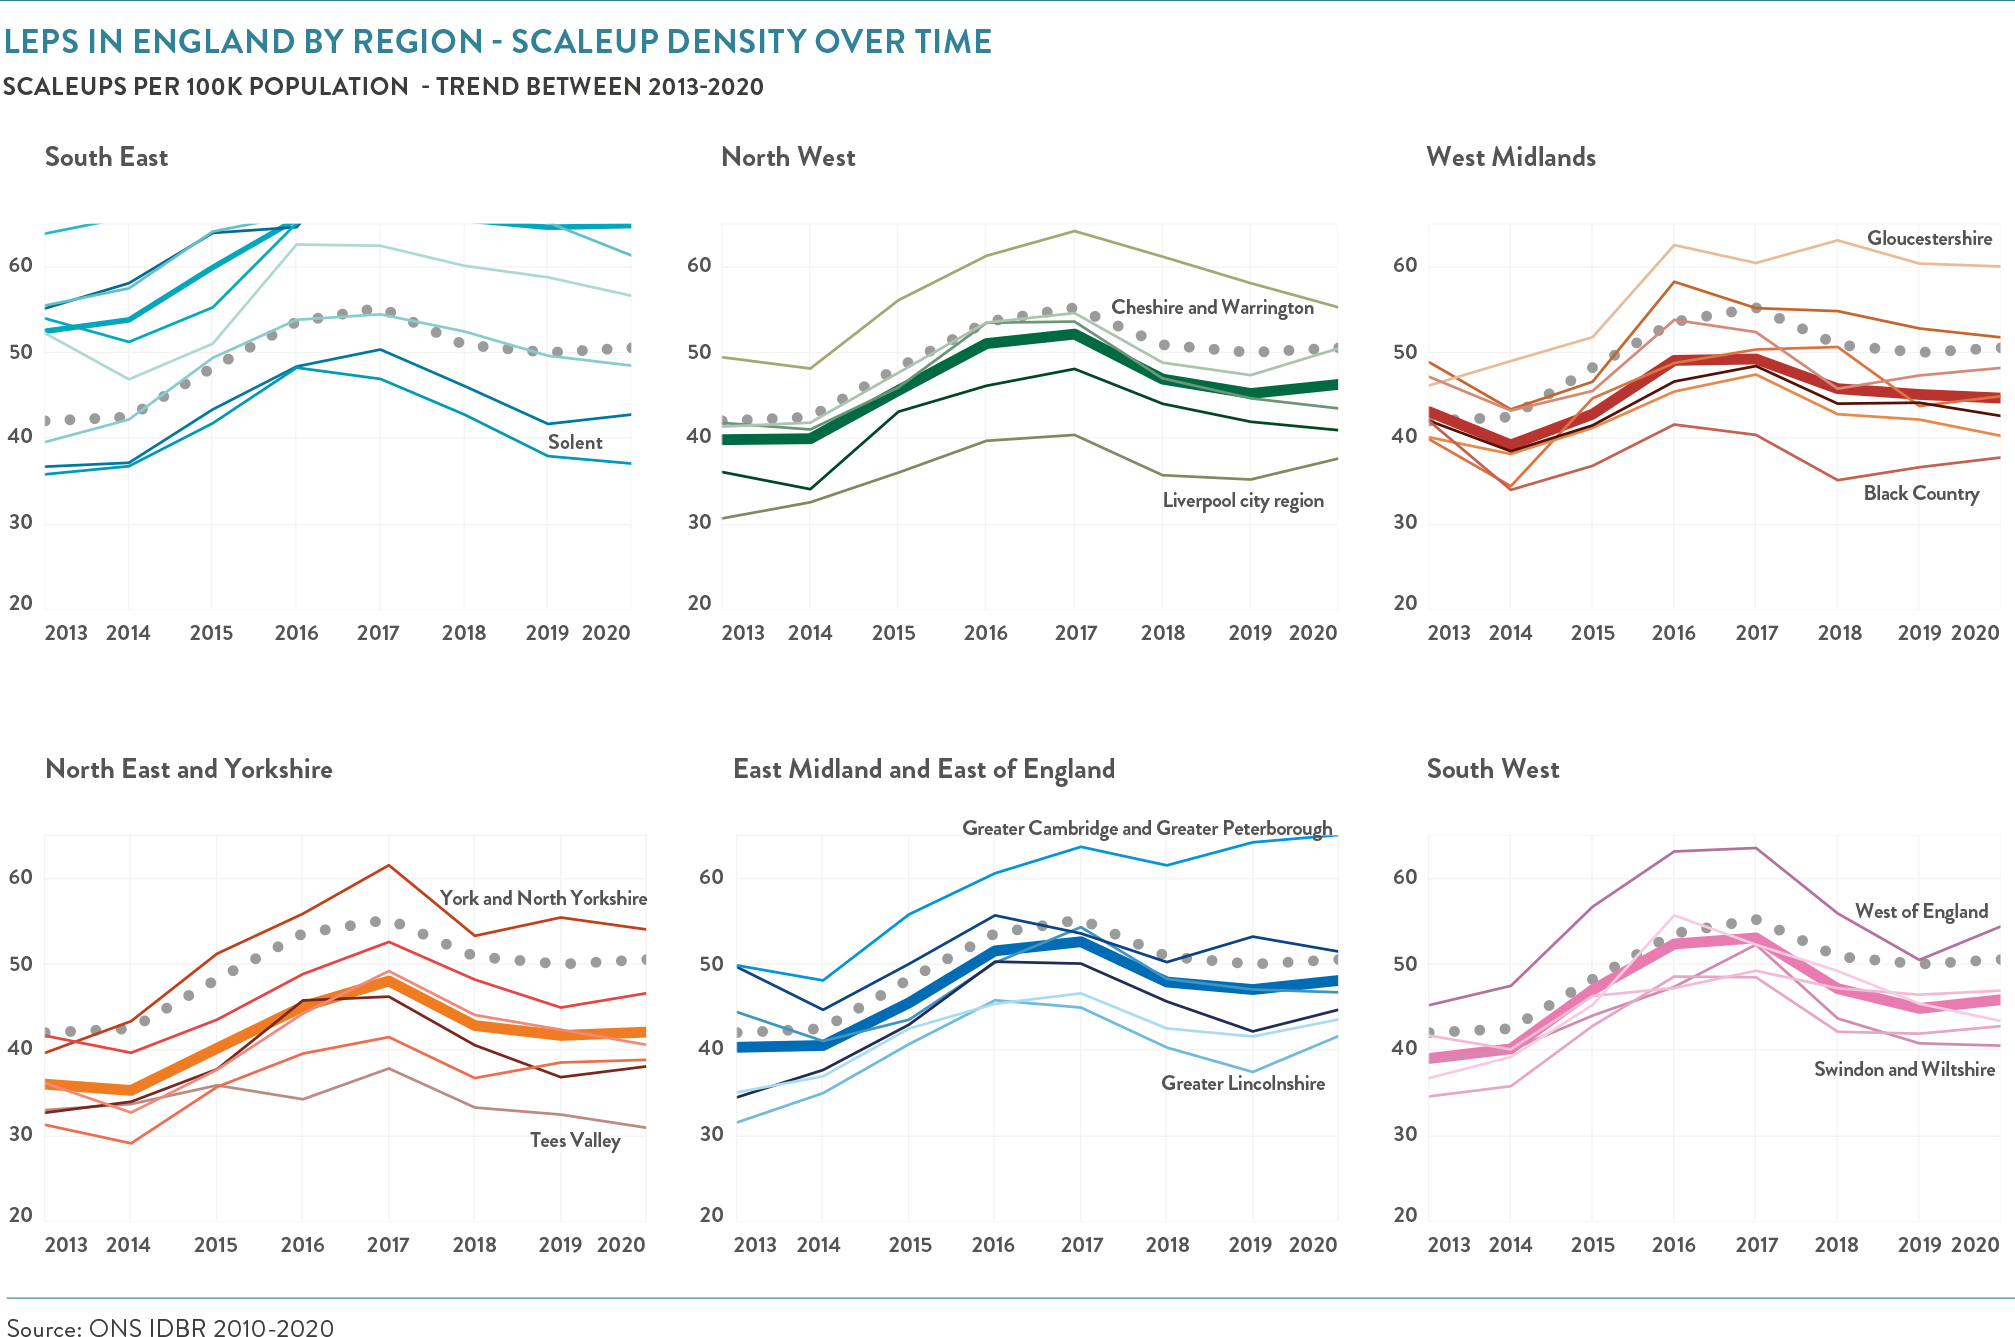
Across English regions and their component LEPs we see variations in scaleup density over time, however since tracking began (as shown on the table above) many have increased density each year and stand above the levels seen in 2013.
However, more recent trends are showing a dip in density since scaleup numbers peaked at 36,510 in 2017.
Local patterns of scaleups – 3 year trends since 2017
Further showing signs of the recent slowdown since 2017, the median growth of scaleups for the rolling 3 year period decreased from -1.4 to -1.9, however the median scaleups per 100k remained consistent with 2019 at 45.0.
Local patterns of turnover and employment scaleups – 3 year trends since 2017
The top 5 LEPs/devolved nations for scaleup density in turnover scaleups were London, Thames Valley Berkshire, Oxfordshire, Greater Cambridge and Greater Peterborough and Enterprise M3.
When looking at scaleup density in employment scaleups, the top 5 LEPs/devolved were London, Thames Valley Berkshire, Oxfordshire, Greater Cambridge and Greater Peterborough and Gloucestershire.
Longer term growth trends in scaleups at a LEP/devolved nation level are illustrated on the map below. Areas of a brighter green exhibiting higher growth and areas of blue showing slower growth or decline in scaleup populations.
Local Authority Picture
The number of scaleups per 100,000 of population varies widely among local authorities. The figure below plots the number of employment and turnover scaleups by local authority against the growth rate.
For employment scaleups, the median growth rate stayed at -0.7 and the median density decreased slightly from 16.1 to 15.3. For turnover scaleups, the median growth rate decreased from -1.3 to -1.6, however the median density increased from 34.9 to 36.3.
CONTENTS

Introduction 2022

Chapter 1 2022
The ScaleUp Business Landscape

Chapter 2 2022
Leading Programmes Breaking Down the Barriers for Scaleups

Chapter 3 2022
The Local Scaleup Ecosystem

Chapter 4 2022
The Policy Landscape

Chapter 5 2022
Looking forward

Annexes 2022

SCALEUP STORIES 2022

 Previous

Share