Explore the ScaleUp Annual Review 2022
Select a section to expand and explore this year's review..
CONTENTS
Introduction 2022
Chapter 1 2022
The ScaleUp Business Landscape
Chapter 2 2022
Leading Programmes Breaking Down the Barriers for Scaleups
Chapter 3 2022
The Local Scaleup Ecosystem
Chapter 4 2022
The Policy Landscape
Chapter 5 2022
Looking forward
Annexes 2022
SCALEUP STORIES 2022
LOCAL ANALYSIS OF GROWTH IN THE SCALING PIPELINE
As observed with scaleups across the UK, there are businesses in the scaling pipeline in every part of the country with 65% of pipeline businesses based outside of London and the South East. There are significant clusters of scaling businesses in the Devolved Nations with Scotland having the second largest concentration behind London.
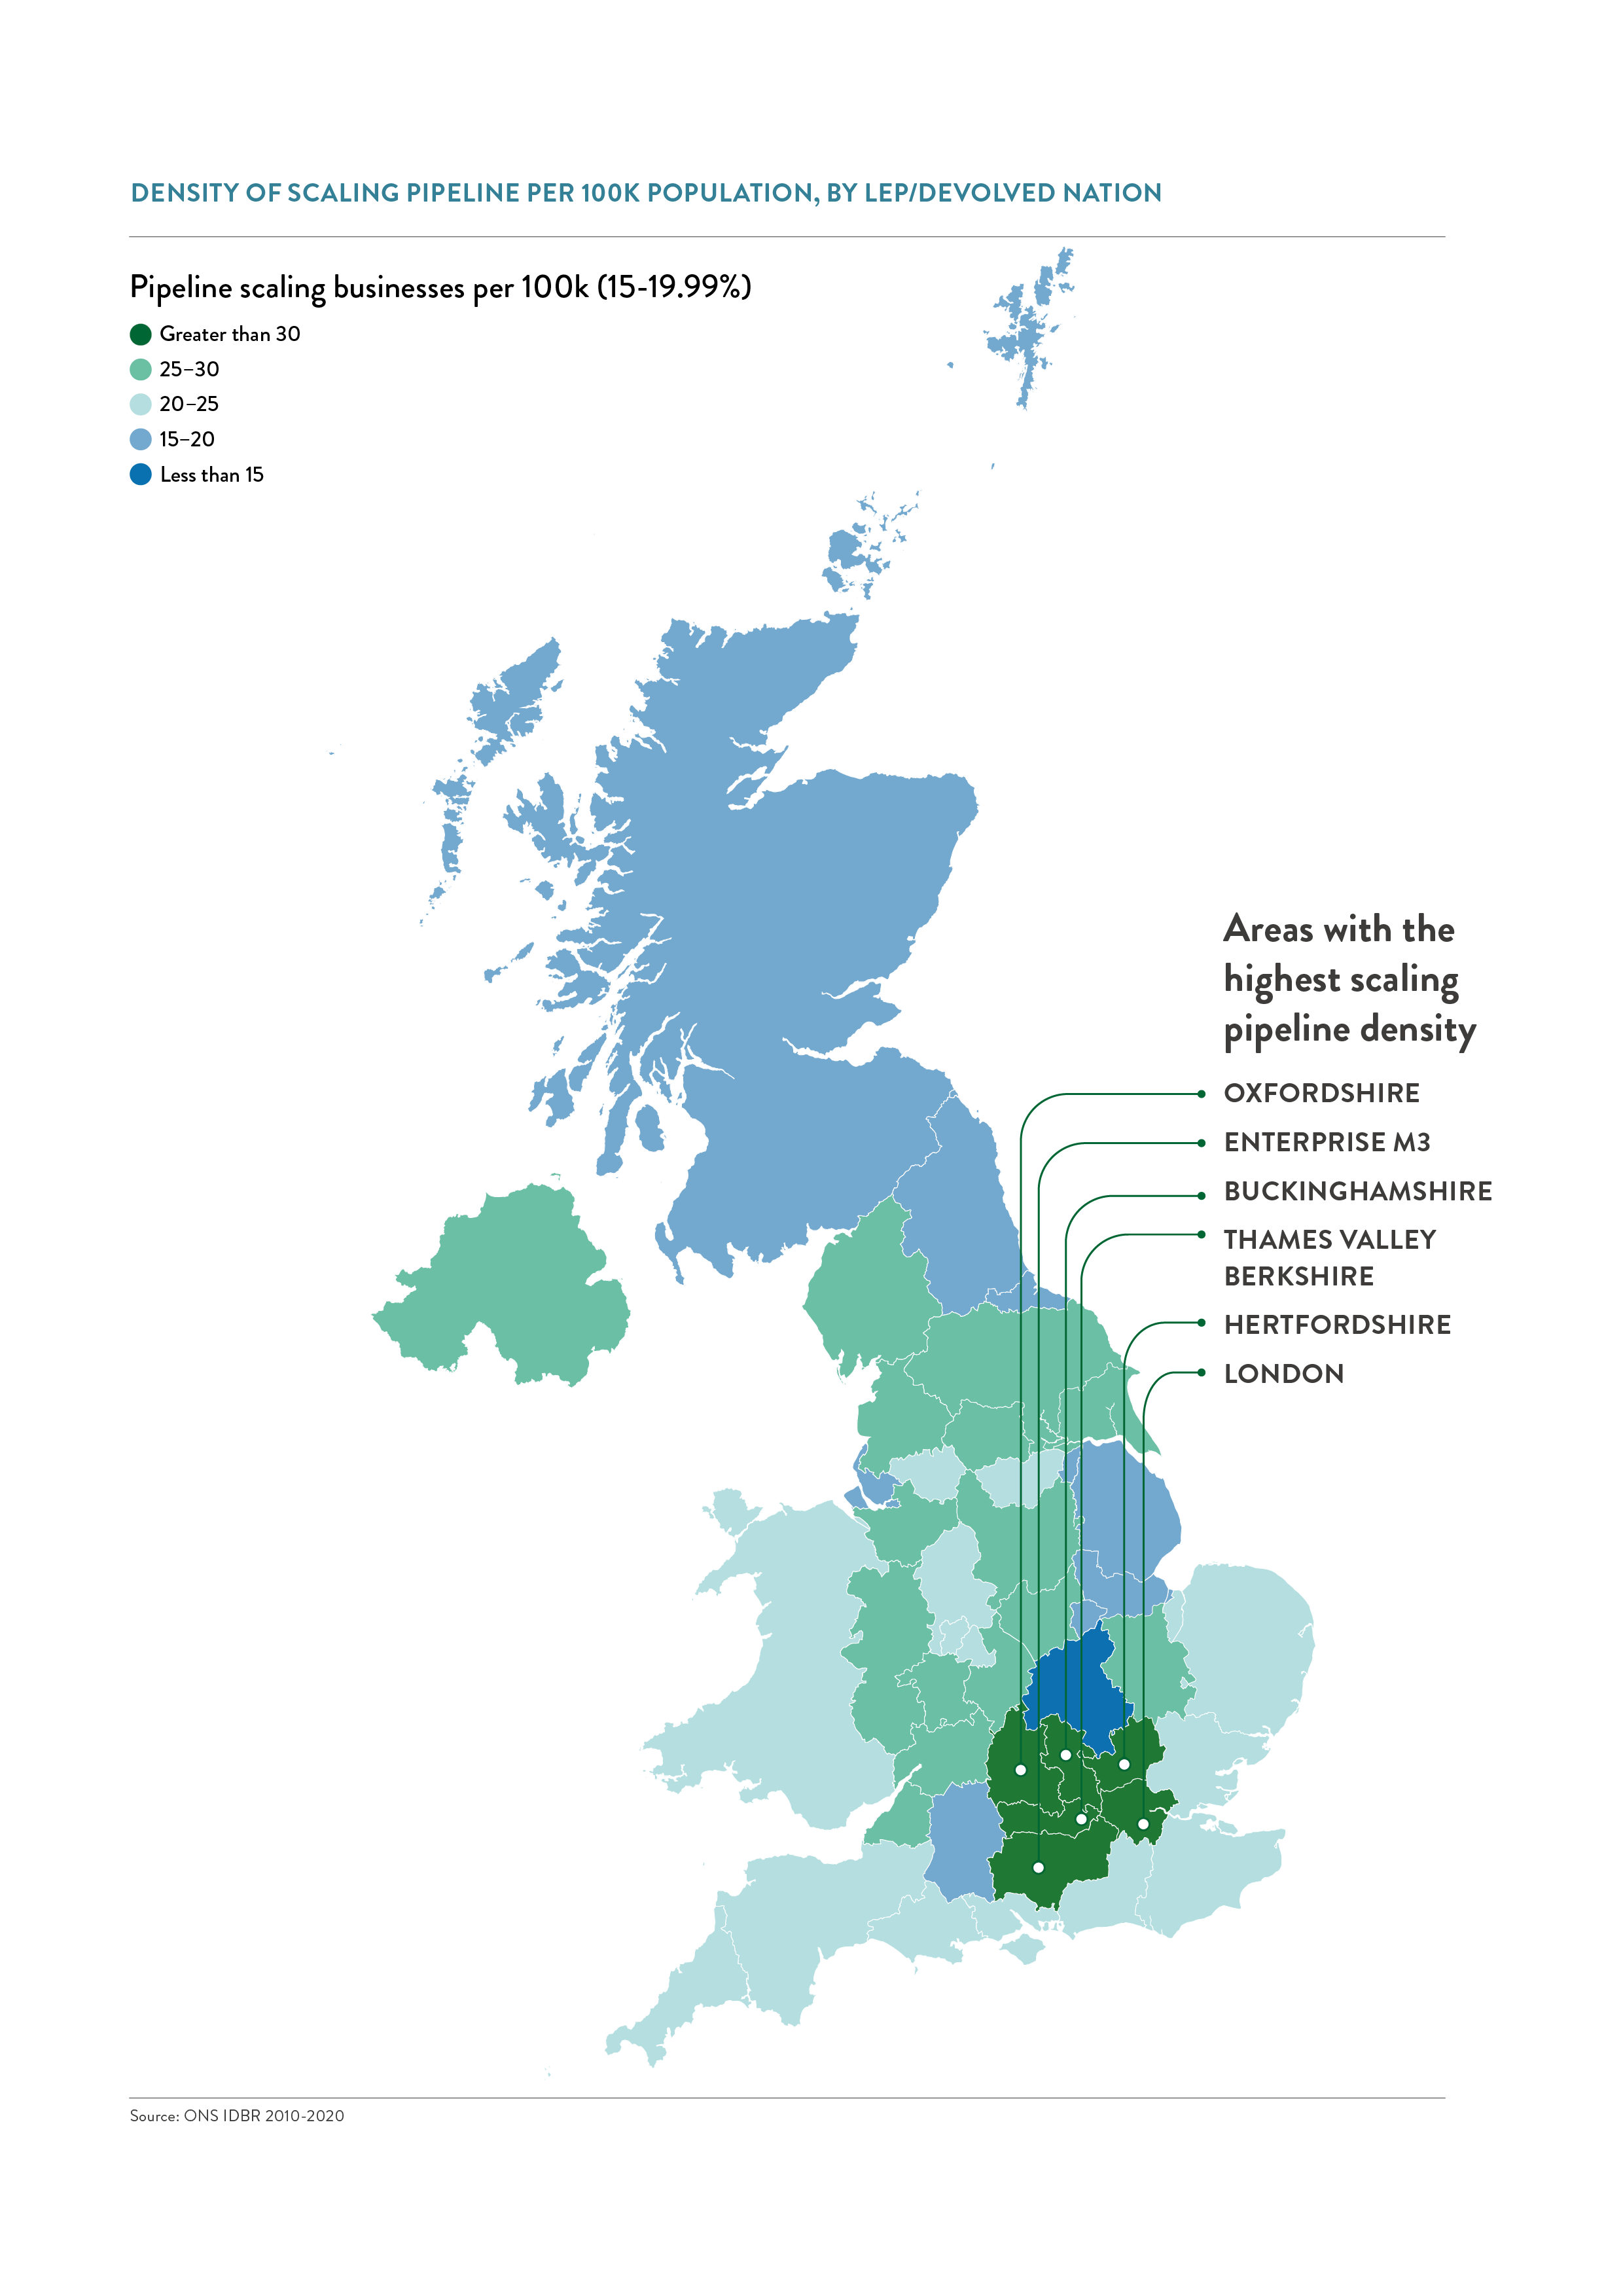
PIPELINE DENSITY PER 100K POPULATION
The density of the scaling pipeline per 100k population is also far more consistent than that of scaleup peers, ranging from 19.2 in the Tees Valley to 32.9 in London (while for scaleups this range is 31 to 82.3 per 100k population respectively). Despite this though regional disparities remain and the most dense clusters are found in southern England.
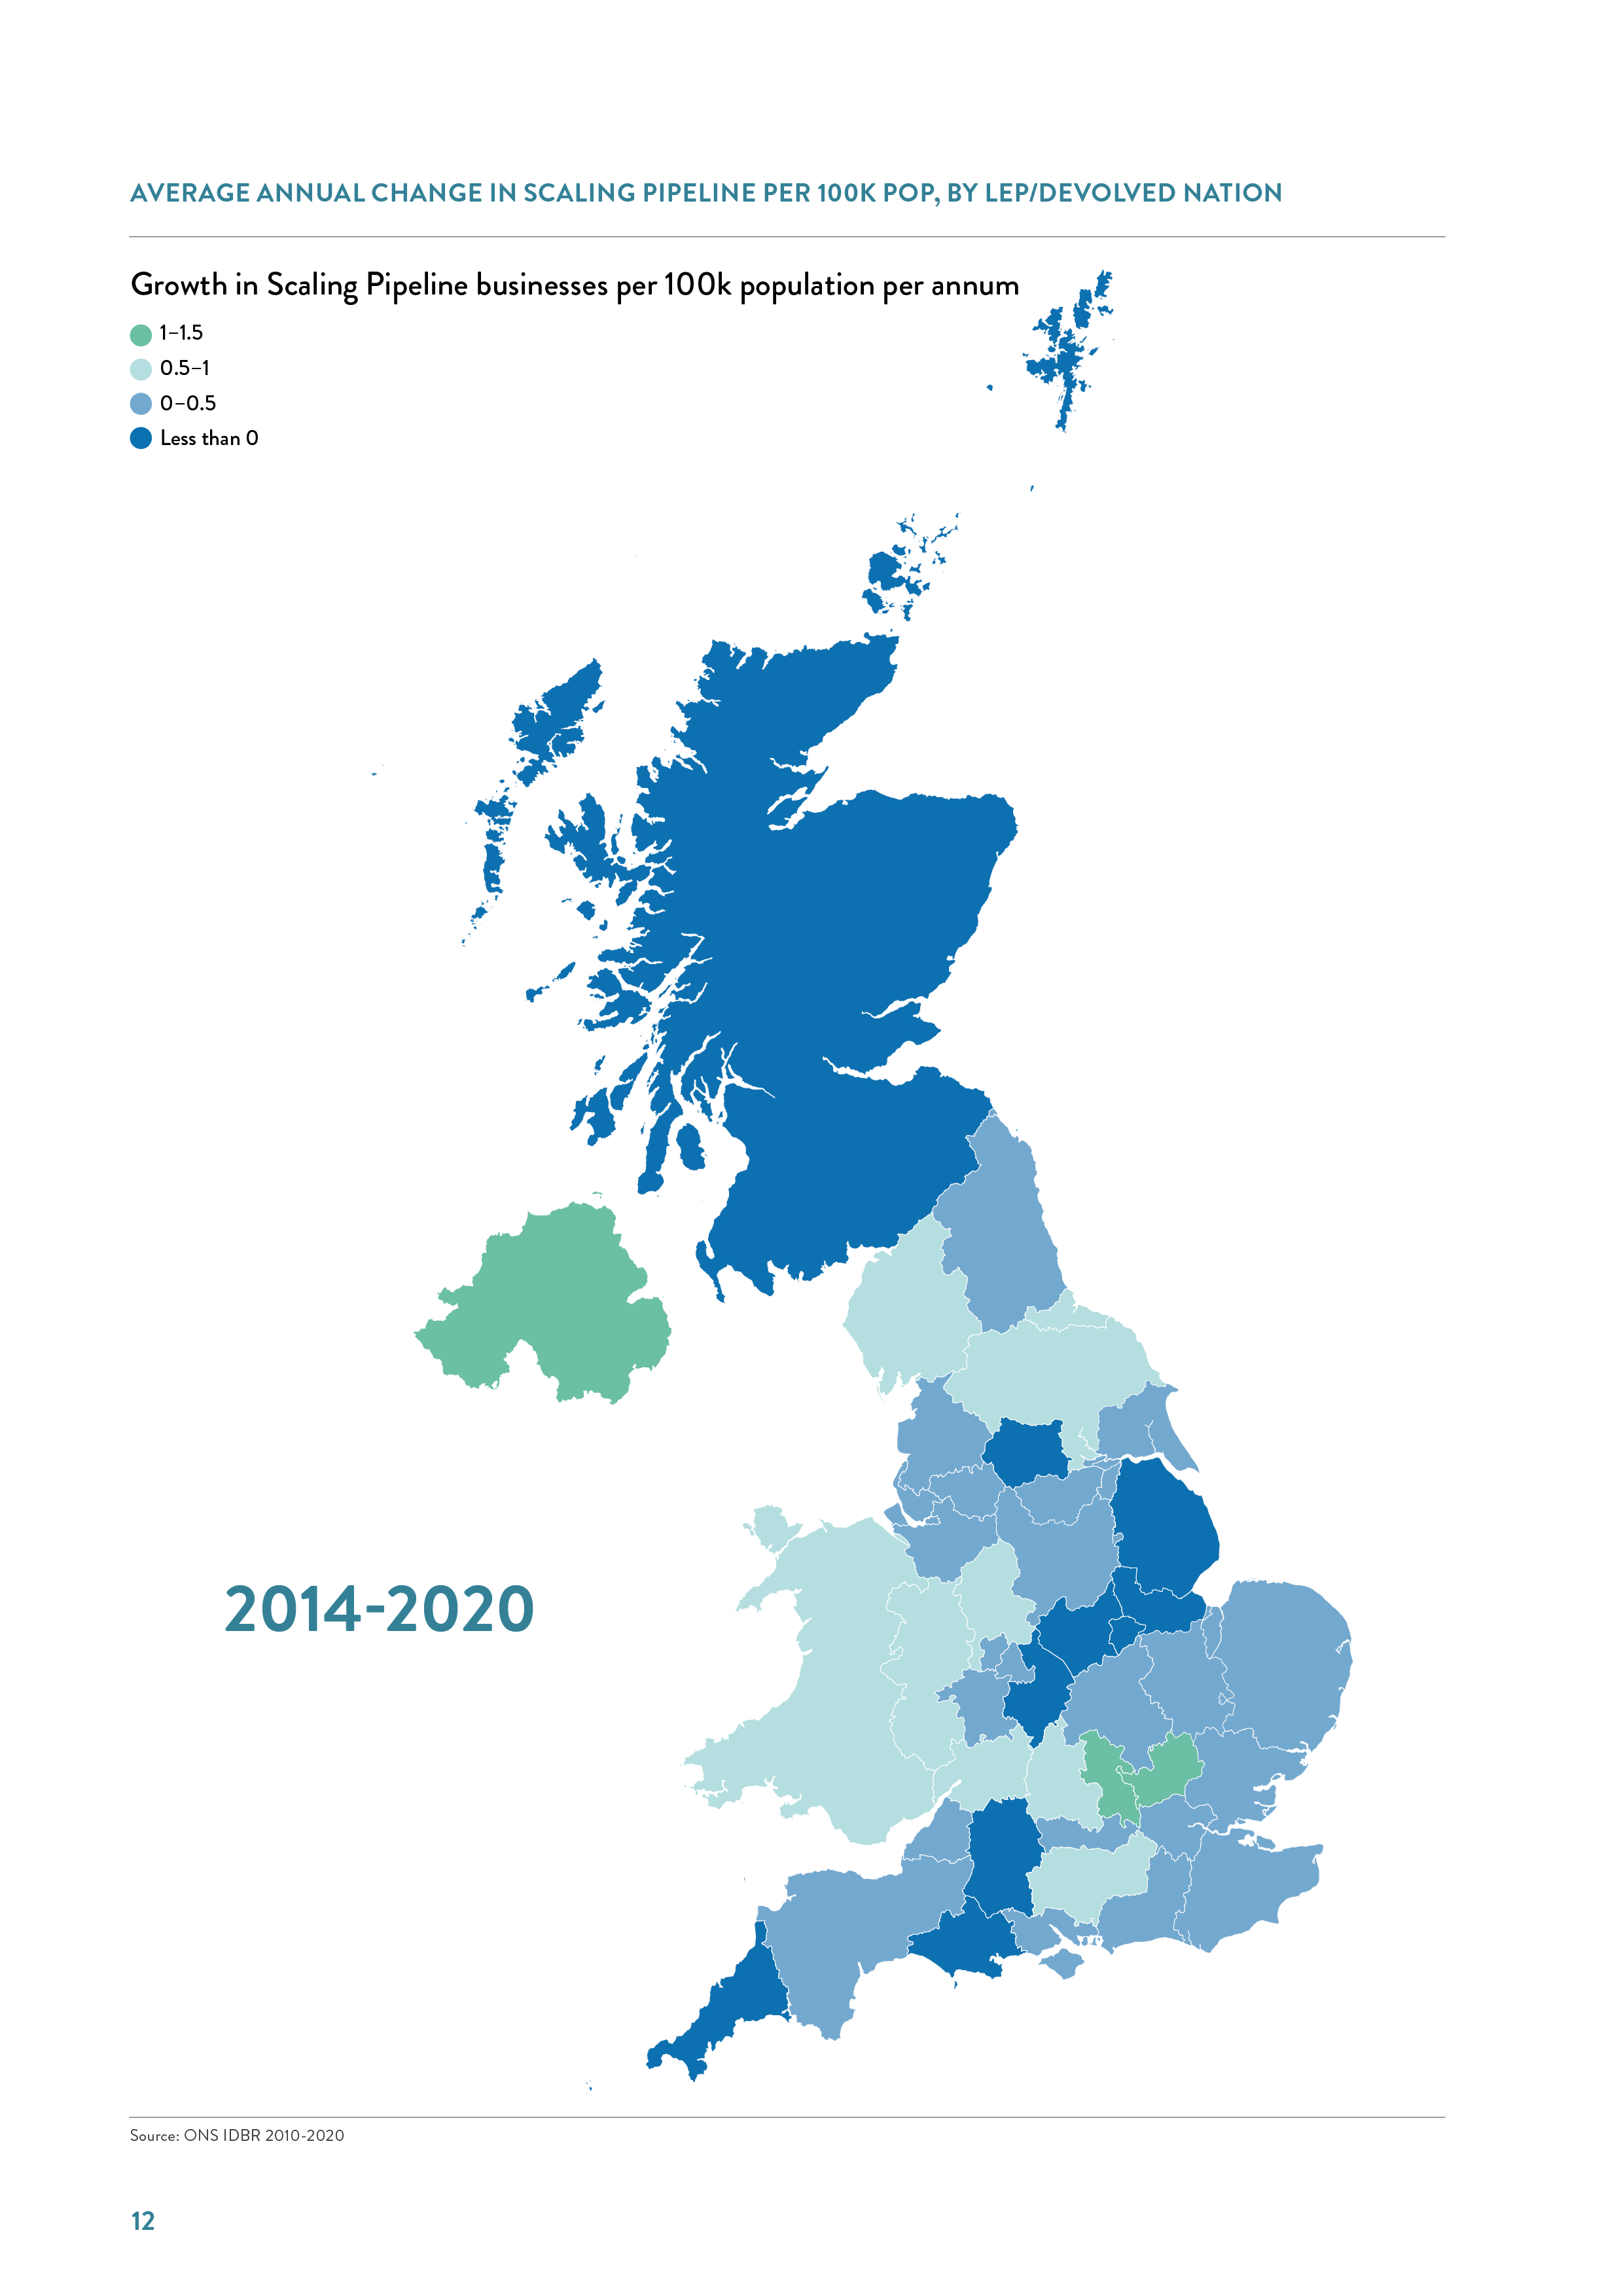
PIPELINE GROWTH ACROSS LOCAL AREAS
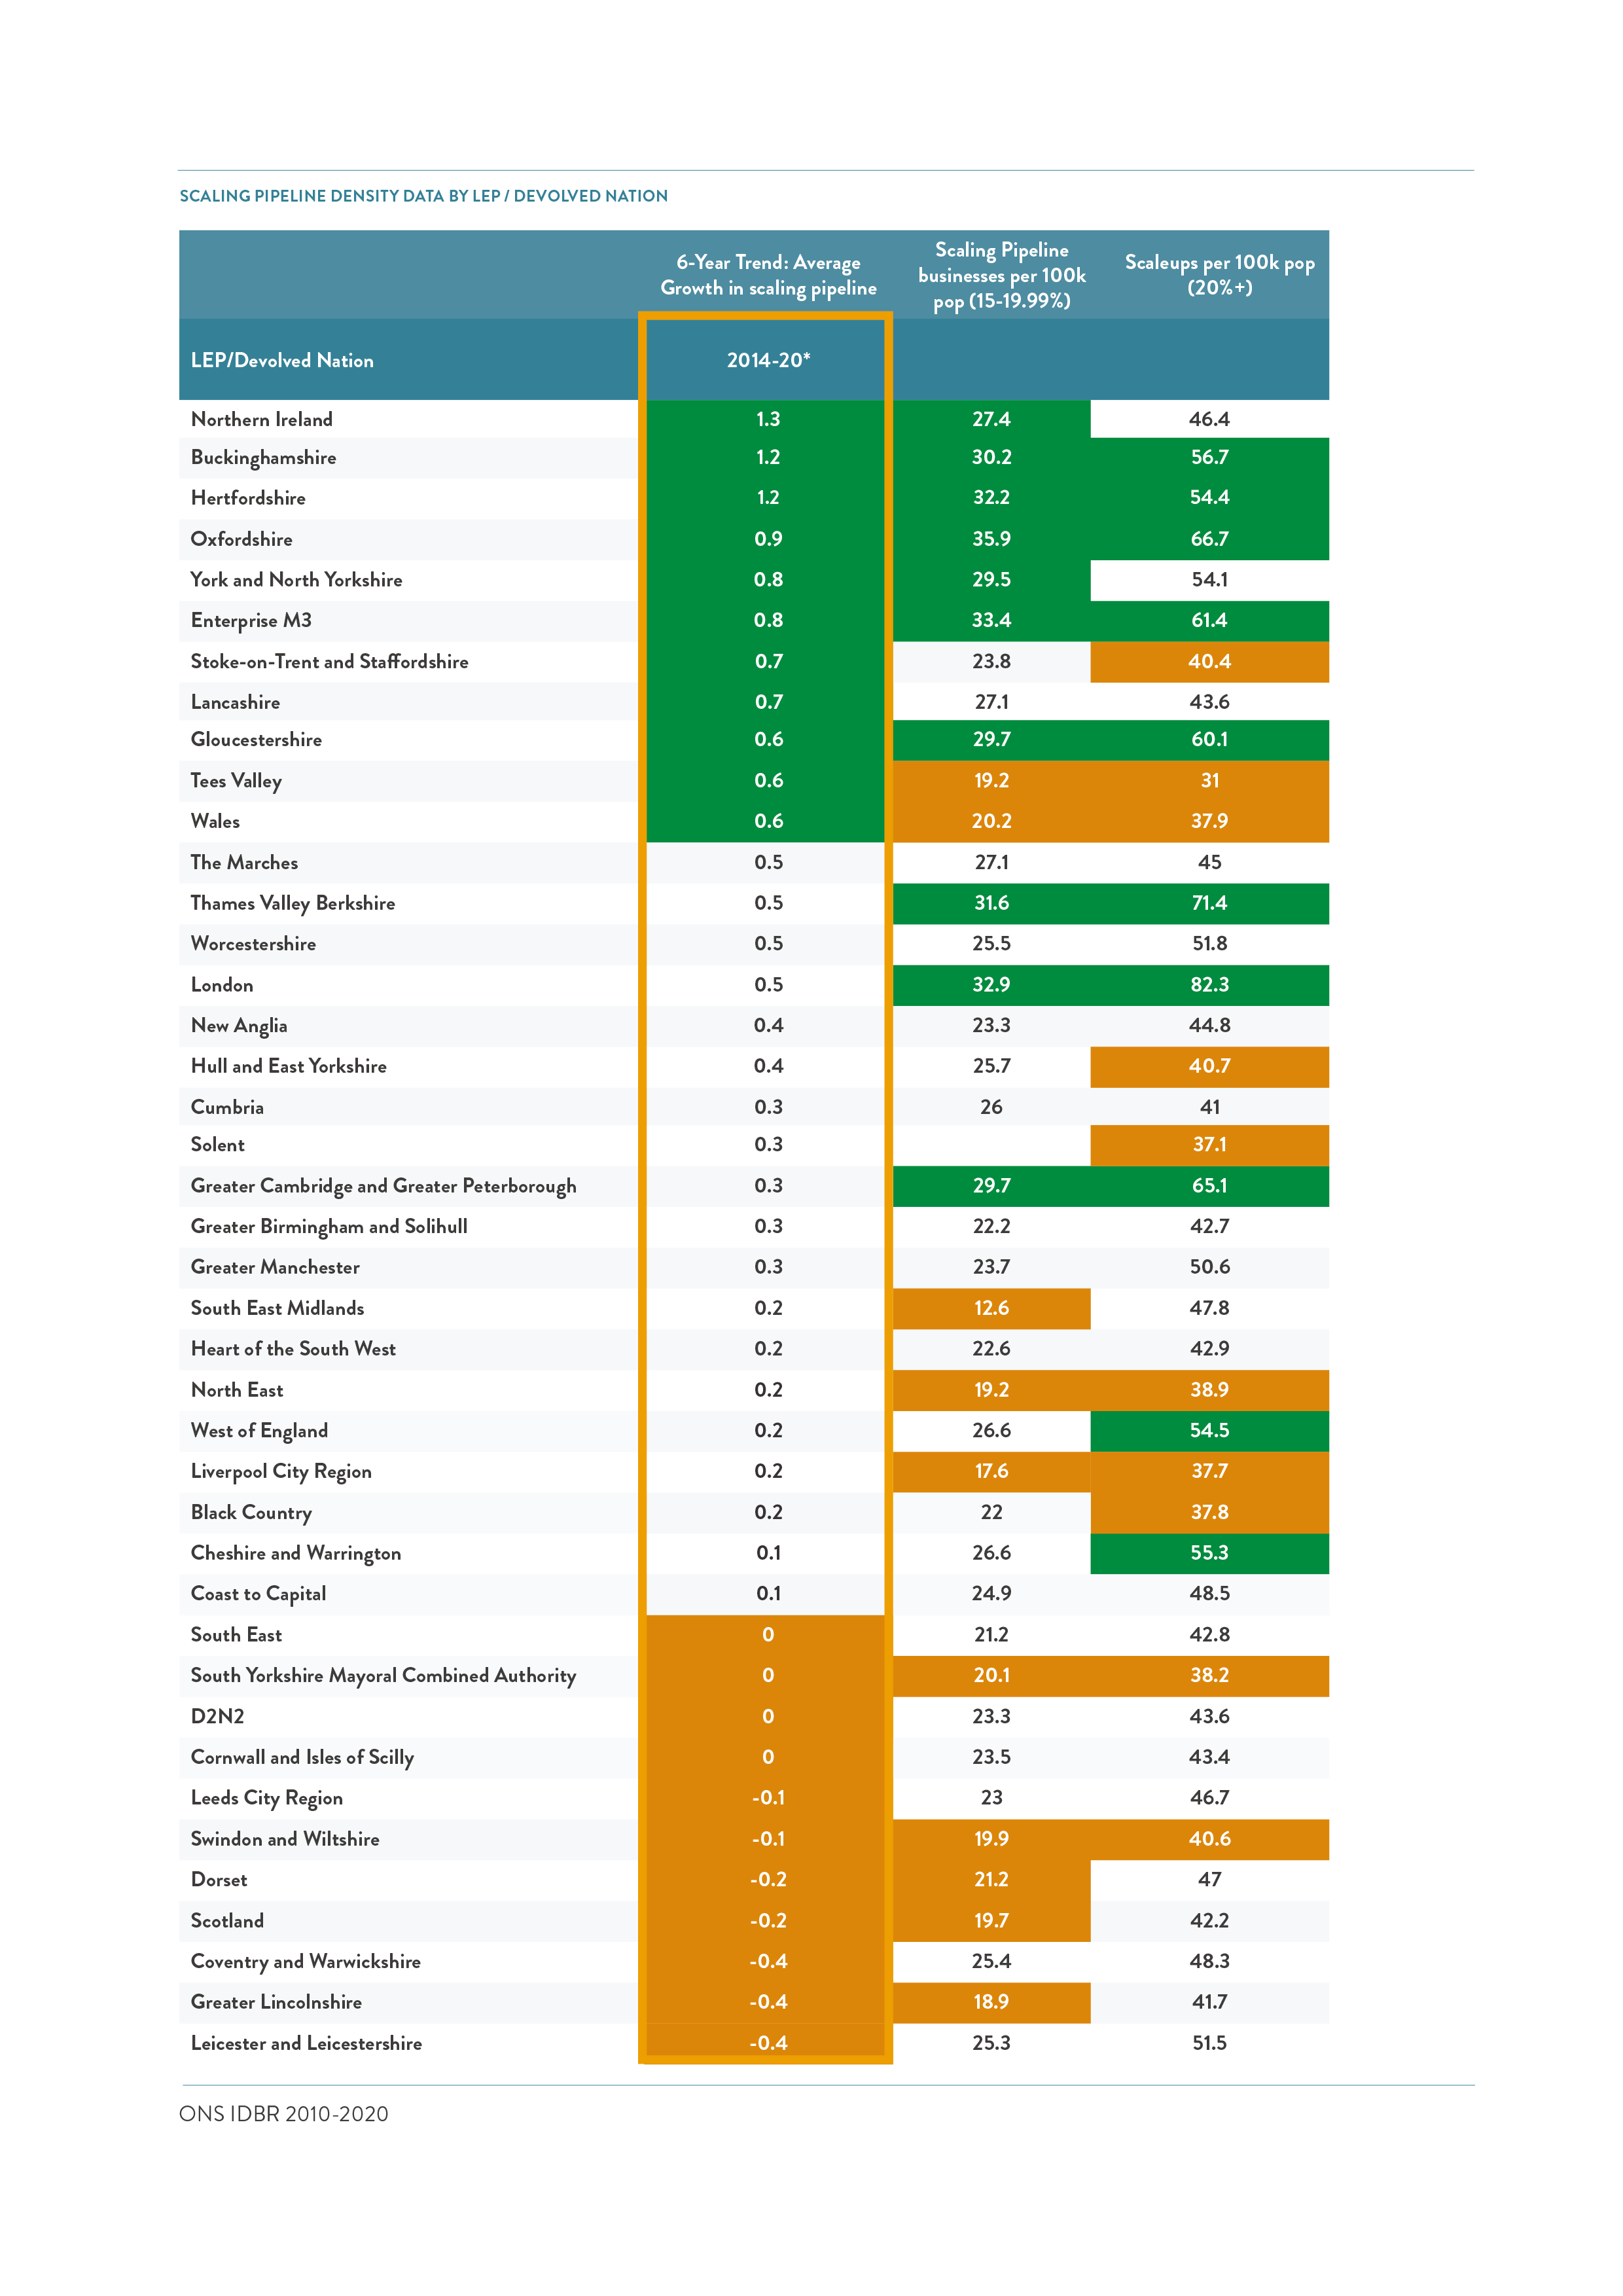
As with the scaleup population we look at trends over time to understand how the scaling pipeline is evolving in the different Devolved Nations, LEPs and local authorities of the UK. Through this analysis and in comparison with the scaleup population we observe:
- 7 LEPs and 1 Devolved Nation (Northern Ireland) are in top 10 local areas for both scaleup and scaling pipeline businesses per 100k population in 2020.
- Despite being in the top 5 most densely populated for both scaleups and scaling pipeline businesses, while also exhibiting the highest growth in numbers of scaleups, Thames Valley Berkshire, London and Greater Cambridge and Greater Peterborough exhibit a far more modest rate of pipeline growth of only 0.5, 0.5 and 0.3 per 100k per annum respectively.
- Positively Stoke-on-Trent & Staffordshire, Tees Valley, and the Black Country are all exhibiting growth in the pipeline density despite experiencing challenges when it comes to scaleup density. This highlights an opportunity locally to redouble efforts to convert more pipeline businesses to full blown scaleups.
- While Oxfordshire has the highest scaling pipeline density in 2020, Northern Ireland tops the list in terms of growth in scaling pipeline density between 2014 to 2020.
- 4 LEPs – Buckinghamshire, Hertfordshire, Oxfordshire and Enterprise M3 are in top 10 in pipeline growth, scaling pipeline density and scaleup density.
- 2 LEPs – South Yorkshire and Swindon & Wiltshire are in bottom 10 in all 3 indicators
Longer term growth trends in the scaling pipeline at a LEP/devolved nation level are illustrated on the map below. Areas of a brighter green exhibiting higher growth and areas of blue showing slower growth or decline in scaleup populations.
CONTENTS
Introduction 2022
Chapter 1 2022
The ScaleUp Business Landscape
Chapter 2 2022
Leading Programmes Breaking Down the Barriers for Scaleups
Chapter 3 2022
The Local Scaleup Ecosystem
Chapter 4 2022
The Policy Landscape
Chapter 5 2022
Looking forward
Annexes 2022
SCALEUP STORIES 2022


Share