Explore the ScaleUp Annual Review 2022
Select a section to expand and explore this year's review..
CONTENTS

Introduction 2022

Chapter 1 2022
The ScaleUp Business Landscape

Chapter 2 2022
Leading Programmes Breaking Down the Barriers for Scaleups

Chapter 3 2022
The Local Scaleup Ecosystem

Chapter 4 2022
The Policy Landscape

Chapter 5 2022
Looking forward

Annexes 2022

SCALEUP STORIES 2022
Scaleup indicators from a national and local perspective
The ScaleUp Institute’s mission is to act as a national data observatory, providing insight on the scaleup ecosystem across the UK. We work collaboratively with stakeholders from the public, private and third sectors, including local players at combined and local authorities, LEPs, regions and devolved nations, to address the barriers to scaleup growth through timely analysis of relevant data.
The ScaleUp Institute with the collaboration of the Office for National Statistics has undertaken a detailed analysis of the ONS 2020 data – the most recent available – against three elements of the OECD high-growth (scaleup) definition. These include the following:
- Scaleups growing by more than 20% per annum by employee growth
- Scaleups growing by more than 20% per annum by turnover growth
- Scaleups growing by more than 20% per annum in both employees and turnover.
In 2022, the ScaleUp Institute has continued to explore the regional, sectoral trends in the data on scaleups and on the scaling pipeline, who are growing their turnover and/or employee headcount by between 15 and 19.99%. For the first time this year we present new insights and analysis on sectoral trends over time and further breakdown of the growth experienced by our scaleups and scaling businesses further showing how they are disproportionately contributing to turnover particularly in 6 sectors – Info & Communication; Professional scientific & tech; Wholesale; Business admin & support services; Construction; and Arts / Creative – where they contribute more than 50% of the total turnover generated by all UK businesses in these sectors with more than 10 employees 3 years ago.
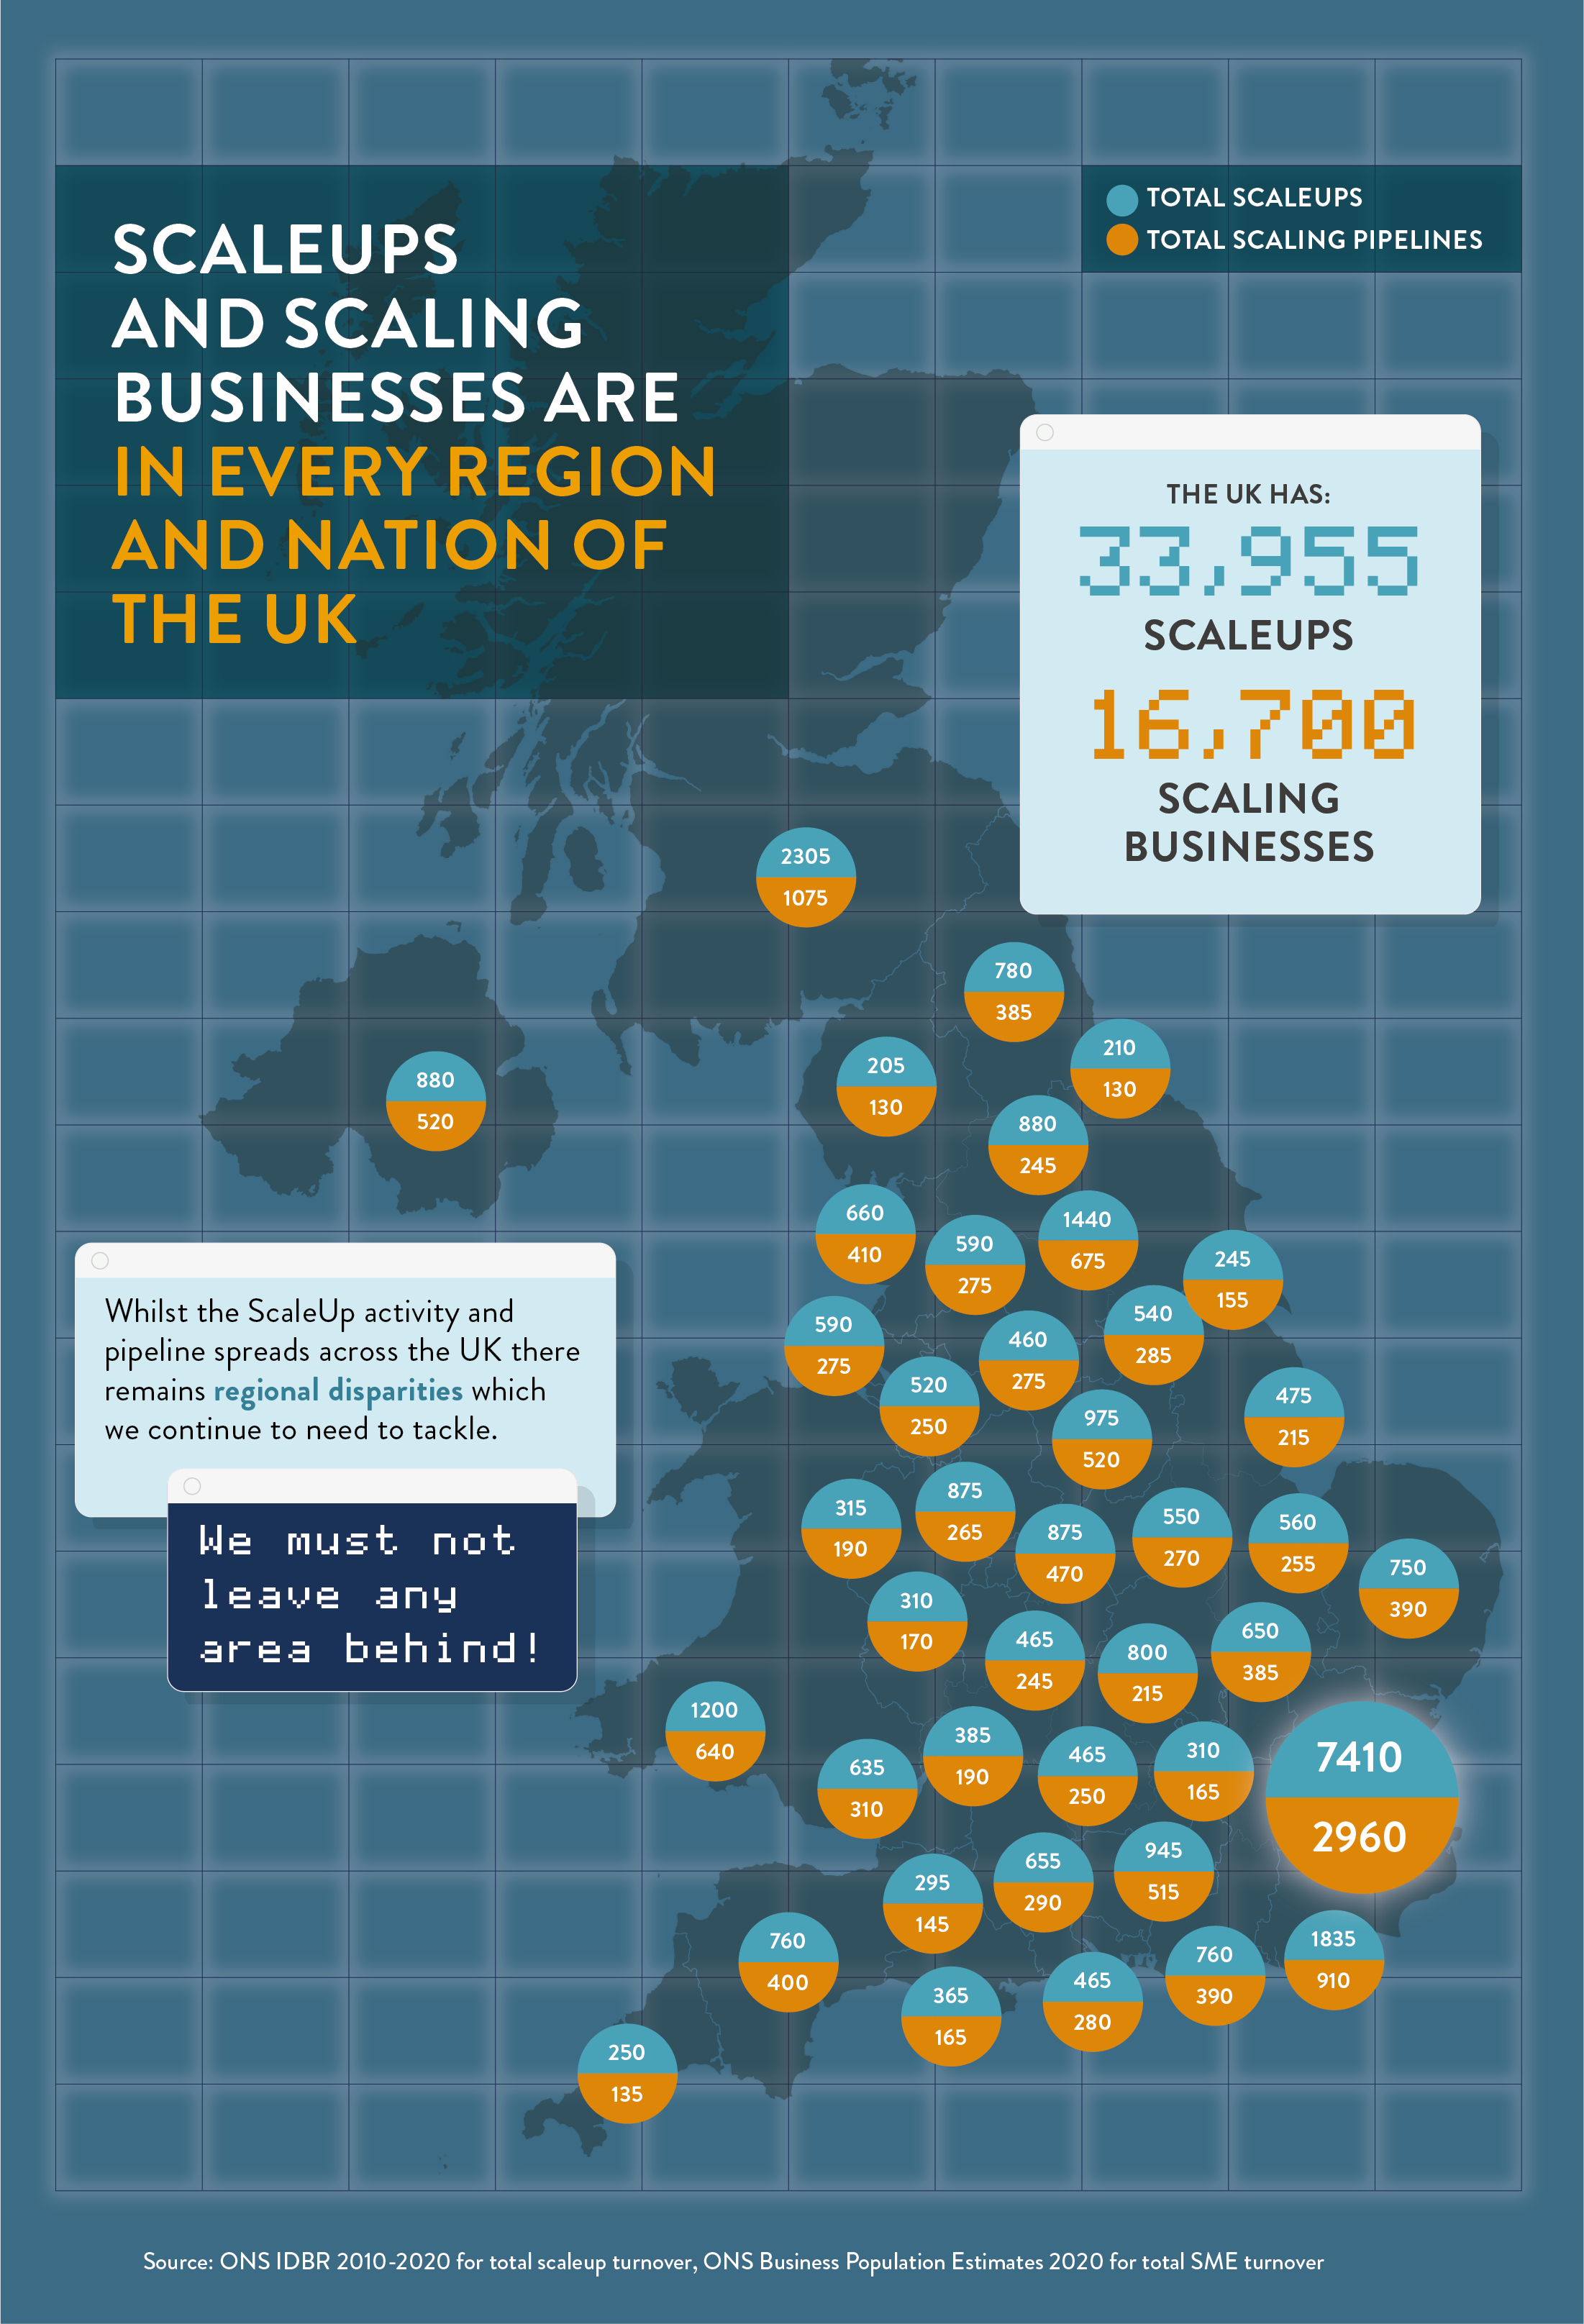
The total number of scaleups increased by 1.5% from 2019 to 33,955 in 2020. The value scaleups contribute to the UK economy remains substantial. In 2020, scaleups employed 3.1million people and generated a total turnover of £1.2trn for the UK economy. It is a striking contribution: 33,955 scaleups, making up less than 0.6% of the SME population, generate more than 50% of the total SME turnover output. Additionally, employment by scaleups is about 18% of the total SME employment.
We have also identified the pipeline of scaling companies who fall just outside the definition of a scaleup – with turnover and/or employment growth of 15-19.99% in the past three years. Here, the numbers have fallen in the last few years of analysis: in 2018 there were 16,890 businesses in this category employing 1.9 million people and generating £592 billion in turnover; in 2020 there were 16,700 employing 1.4m people and generating £410bn in turnover.
Scaleups and scaling pipeline businesses reach out across the entire economy. They operate across all sectors and geographies and are significant drivers of local employment. The map below shows the spread of scaleups and scaling pipeline business across the UK by number. While there is an excellent regional distribution throughout the UK with 73% outside London and South East, when looking at density there remains a slowdown in regional growth of scaleups per 100,000 of population – emphasising the importance of pipeline convergence – and regional disparities where progress has been consistent in some areas but other areas continue to show significant fluctuations in performance and a lag persists. We explore these trends further in this chapter.
The economic impact of all parts of the UK achieving consistent scaleup growth will be immense – but achieving it is not easy. We also look at sectoral spread around the country in detail to unpack the clusters around different regions and their contribution in terms of employment and turnover. It is crucial now to ensure the sectoral and regional support provided is aligned with the cluster makeup of the scaleups.
CONTENTS

Introduction 2022

Chapter 1 2022
The ScaleUp Business Landscape

Chapter 2 2022
Leading Programmes Breaking Down the Barriers for Scaleups

Chapter 3 2022
The Local Scaleup Ecosystem

Chapter 4 2022
The Policy Landscape

Chapter 5 2022
Looking forward

Annexes 2022

SCALEUP STORIES 2022


 Previous

Share