Explore the ScaleUp Annual Review 2022
Select a section to expand and explore this year's review..
CONTENTS

Introduction 2022

Chapter 1 2022
The ScaleUp Business Landscape

Chapter 2 2022
Leading Programmes Breaking Down the Barriers for Scaleups

Chapter 3 2022
The Local Scaleup Ecosystem

Chapter 4 2022
The Policy Landscape

Chapter 5 2022
Looking forward

Annexes 2022

SCALEUP STORIES 2022
The ScaleUp Landscape
The ScaleUp Institute’s analysis of the latest ONS data showed that in 2020 there were 33,955 scaleups in the UK.
The total number of scaleups increased by 1.5% from 2019. This was driven by a 4.9% increase in the number scaling by turnover but compared to 2019 the number scaling by employment fell by 2.8% and those scaling by both turnover and employment fell by 5.1%. It is encouraging that scaleup numbers remained constant despite the unprecedented challenge of the onset of the global pandemic in Q1 2020. However, this is an early snapshot and the full picture of the impact of the pandemic on scaleup numbers will take time to emerge.
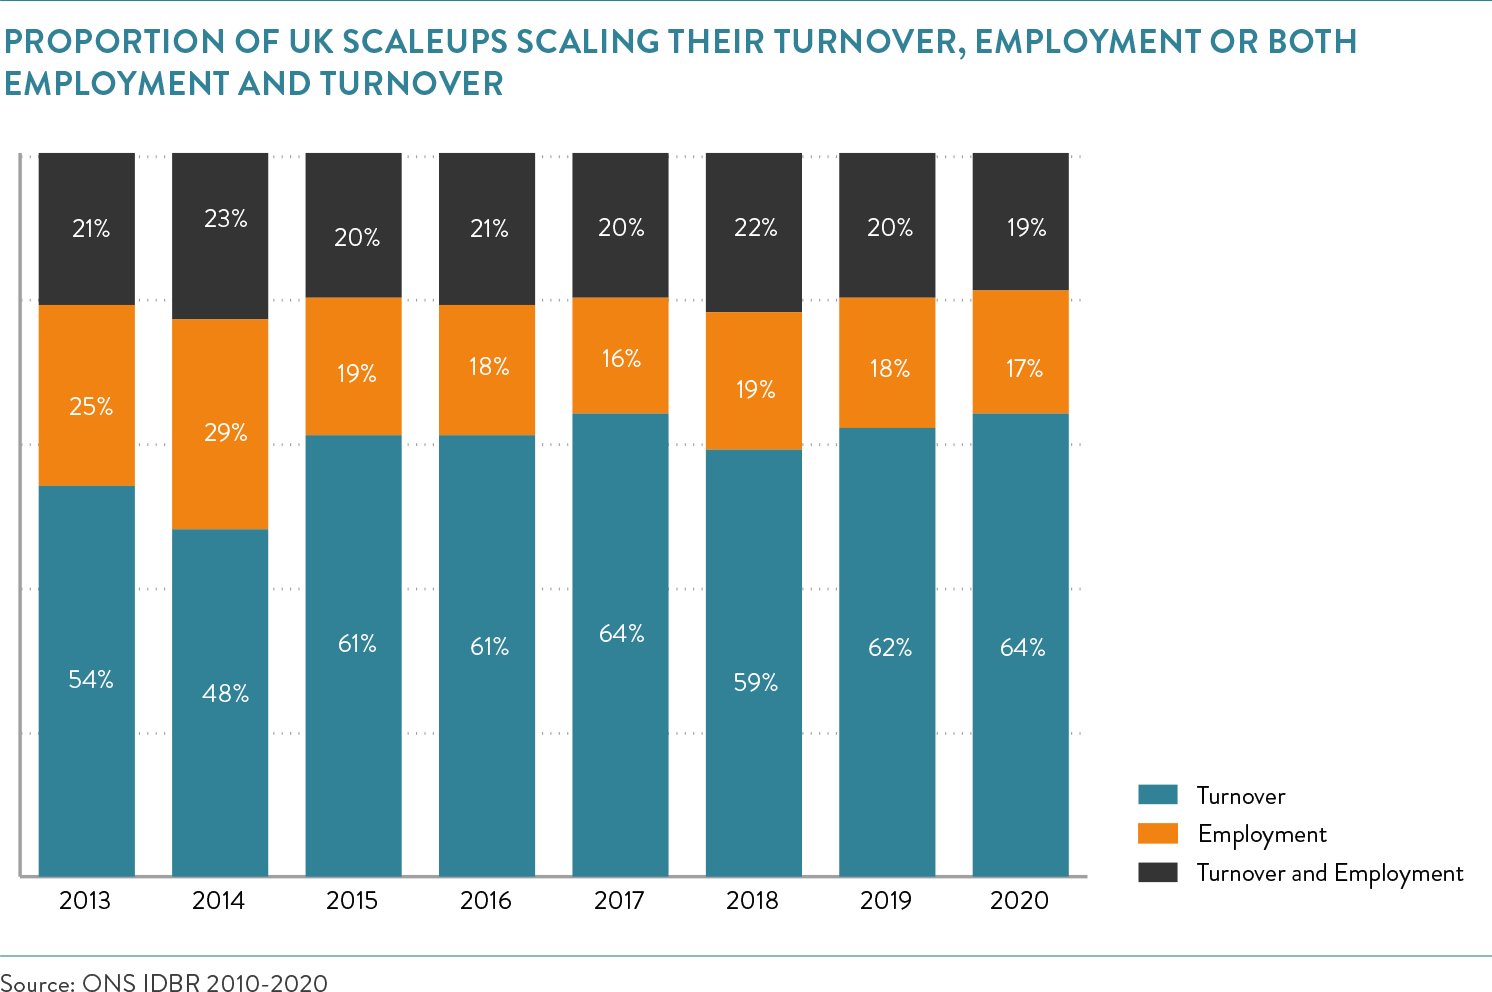
Importantly, the total number of scaleups is 26% higher than it was in 2013.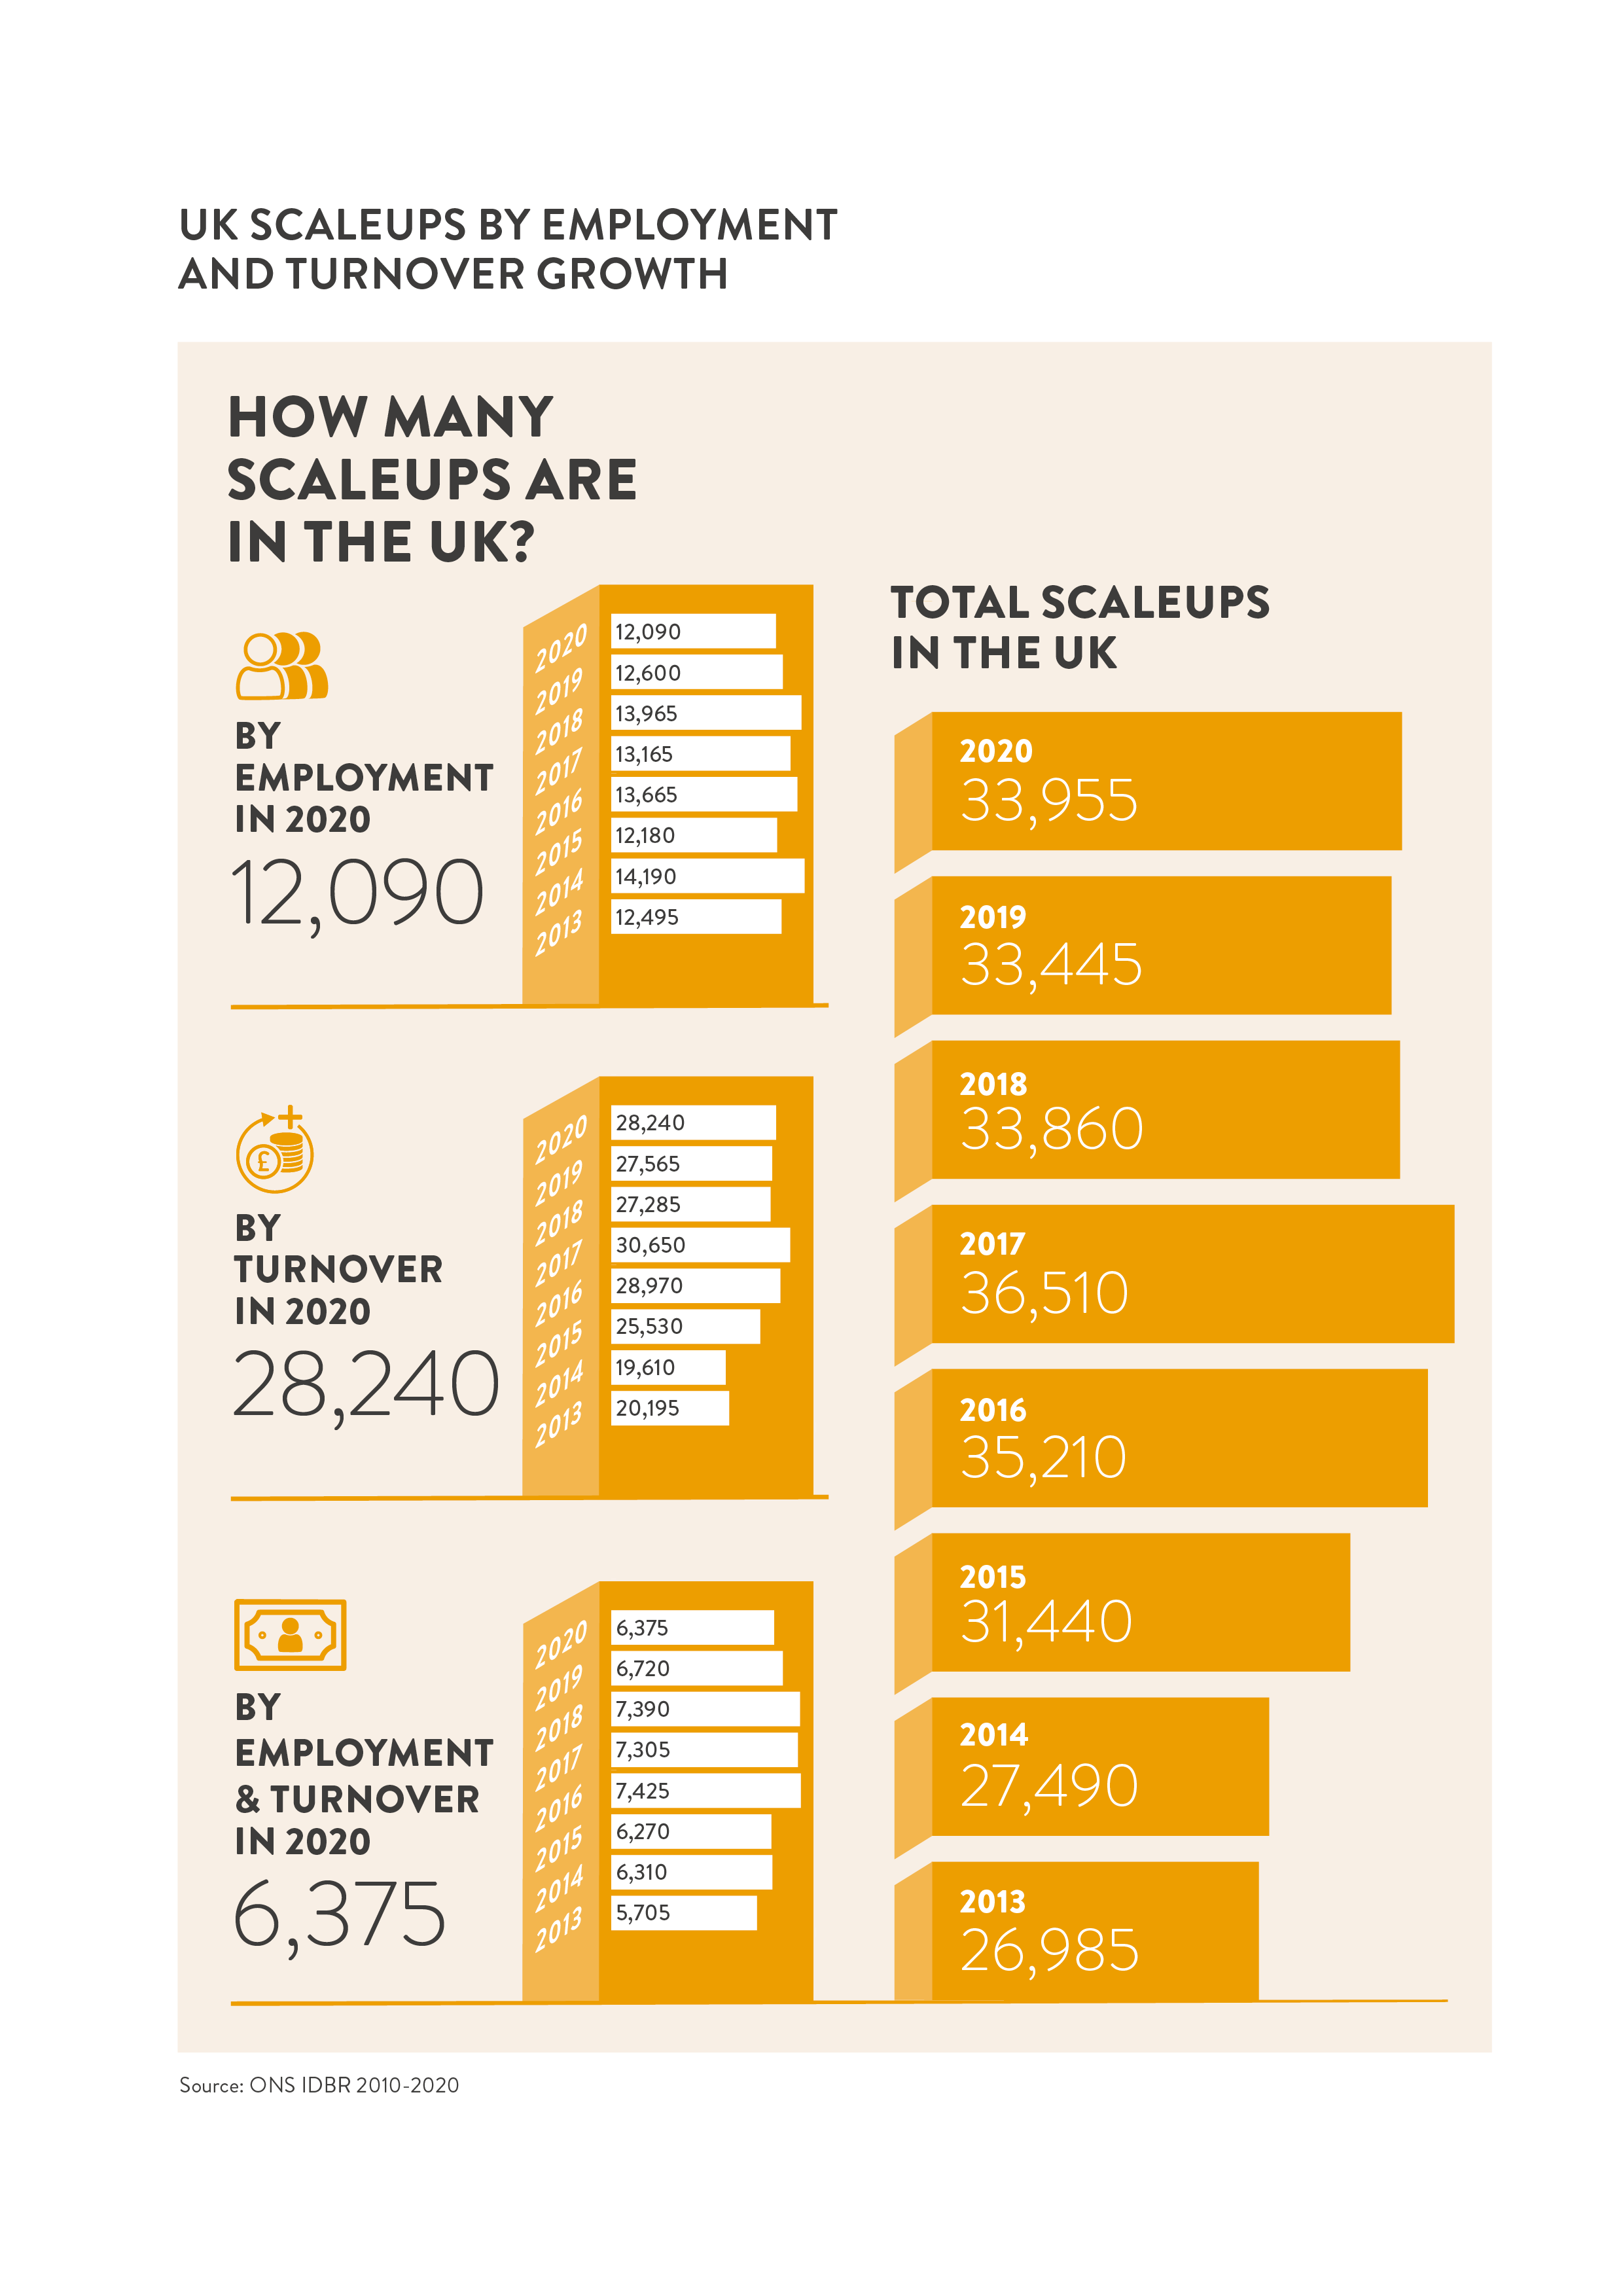 The pattern by which scaleups grow remains relatively steady. Since 2015, approximately six in ten scaleups have grown by turnover; two in ten scale by employment, and a similar proportion scale by both turnover and employment.
The proportion of turnover scaleups is 64% – the highest level since 2017.
Scaleups continue to be the growth and productivity stars in the SME universe
As seen in previous years, the value scaleups contribute to the UK economy remains substantial. In 2020, scaleups employed 3.1million people and generated a total turnover of £1.2trn for the UK economy. The average turnover per scaleup was £34.4m with an average of 92 employees. The average turnover per employee was £373,313 – a 10% increase over 2019.
The UK’s nearly six million SMEs generate a total turnover of £2.3 trn – scaleups represent over 50% of this total output despite making up less than 0.6% of the SME population emphasising the critical need for segmentation and tailored policy, solutions and services for scaling firms in our public, private and education sectors.
Scaleup growth exceeds GDP growth
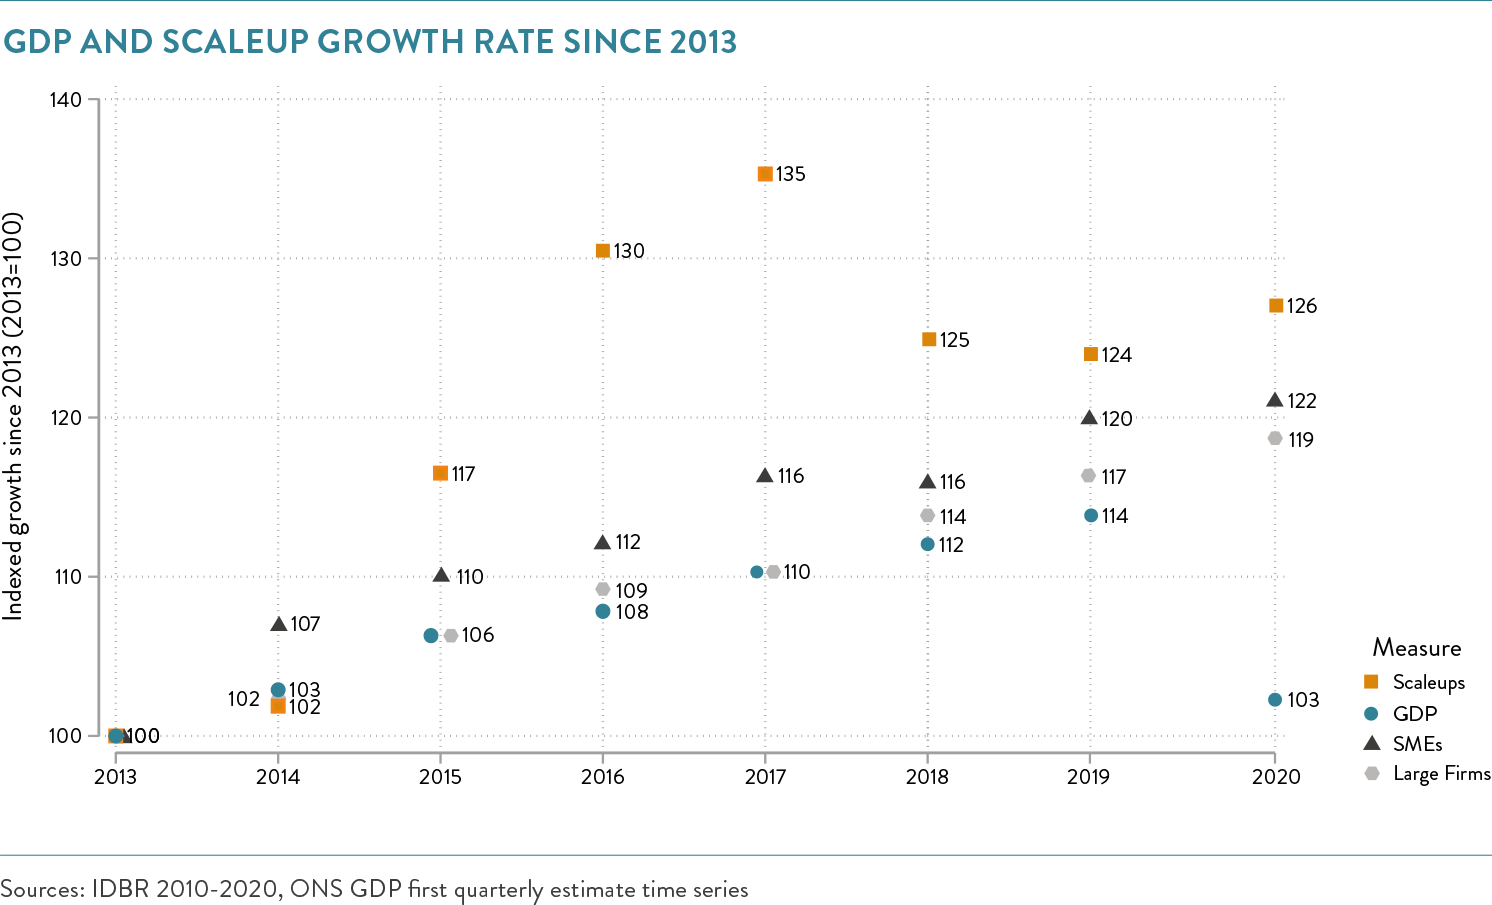
In the seven year period between 2013 to 2020, the number of scaleups has grown by 26%. Over the same period, the number of SMEs grew by 22%. This chart shows how scaleup growth has consistently exceeded GDP growth – 23% in 2020.
Scaleups: driving productive growth
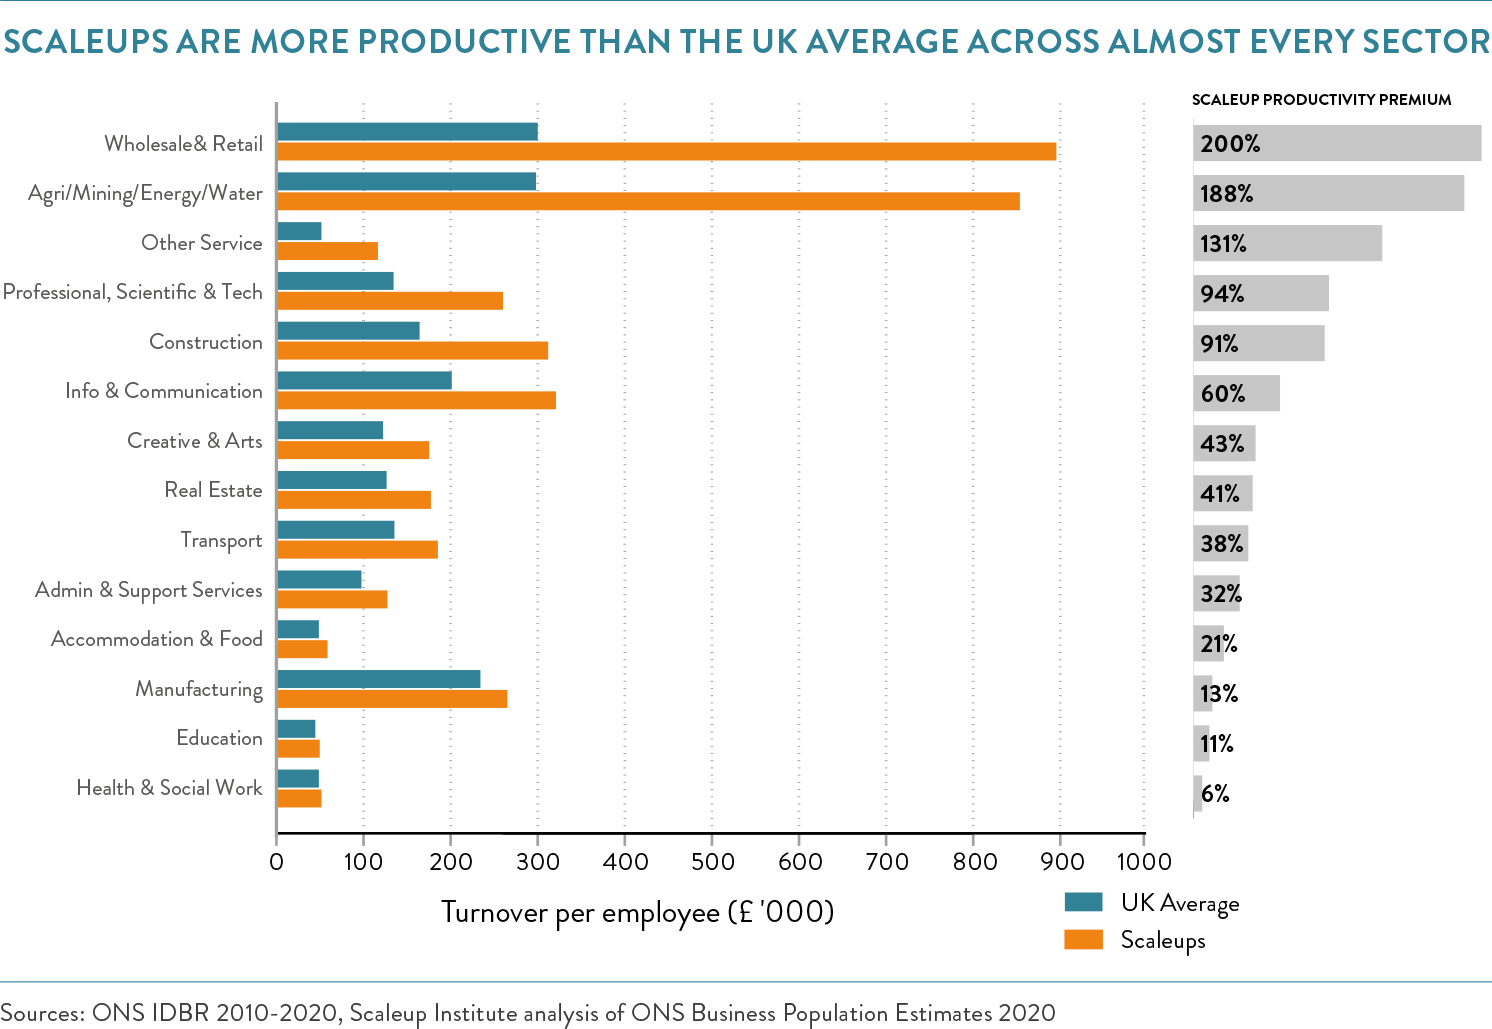
In every single sector of the economy, scaleups are more productive than all other UK businesses. In 2020, the productivity premium of scaleups across all sectors was 42%. Scaleups in the Wholesale & Retail sector outperformed the productivity of their peers by 200%. Other sectors to demonstrate notable levels of productivity out performances were Agriculture/Mining/Energy/Water; Other Services; Professional, Scientific & Technical; and Construction.
Scaleup productivity by sector against the average firm in the sector
Patterns of turnover and employment growth
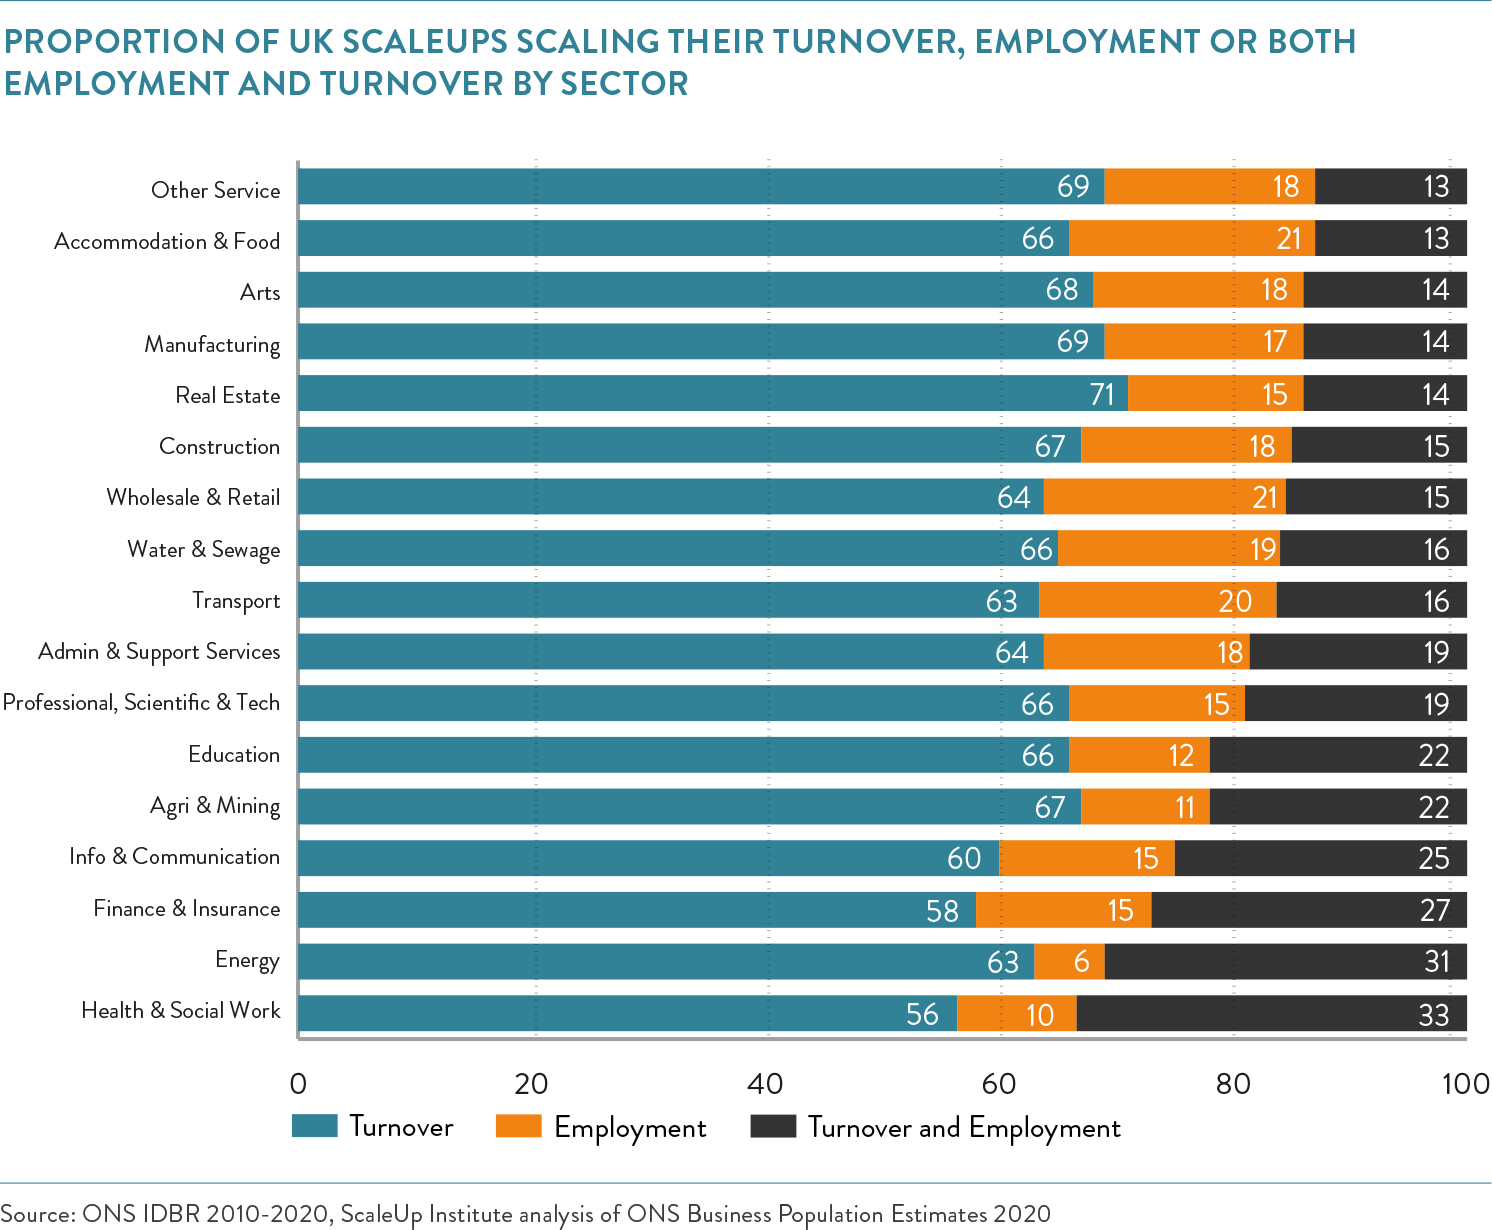
BY SECTOR
In 2020, businesses across sectors scaled in a similar way to those in 2019 – though the percentage of those scaling by turnover increased.
- Health/Social Work continues to be the sector with the highest proportion (33%) of companies scaling by both turnover and employment.
- Accommodation & Food services and Wholesale and Retail (21%) were the most likely to scale exclusively by employment, whereas scaleups in Real Estate remained the most likely to scale exclusively by turnover (71%).
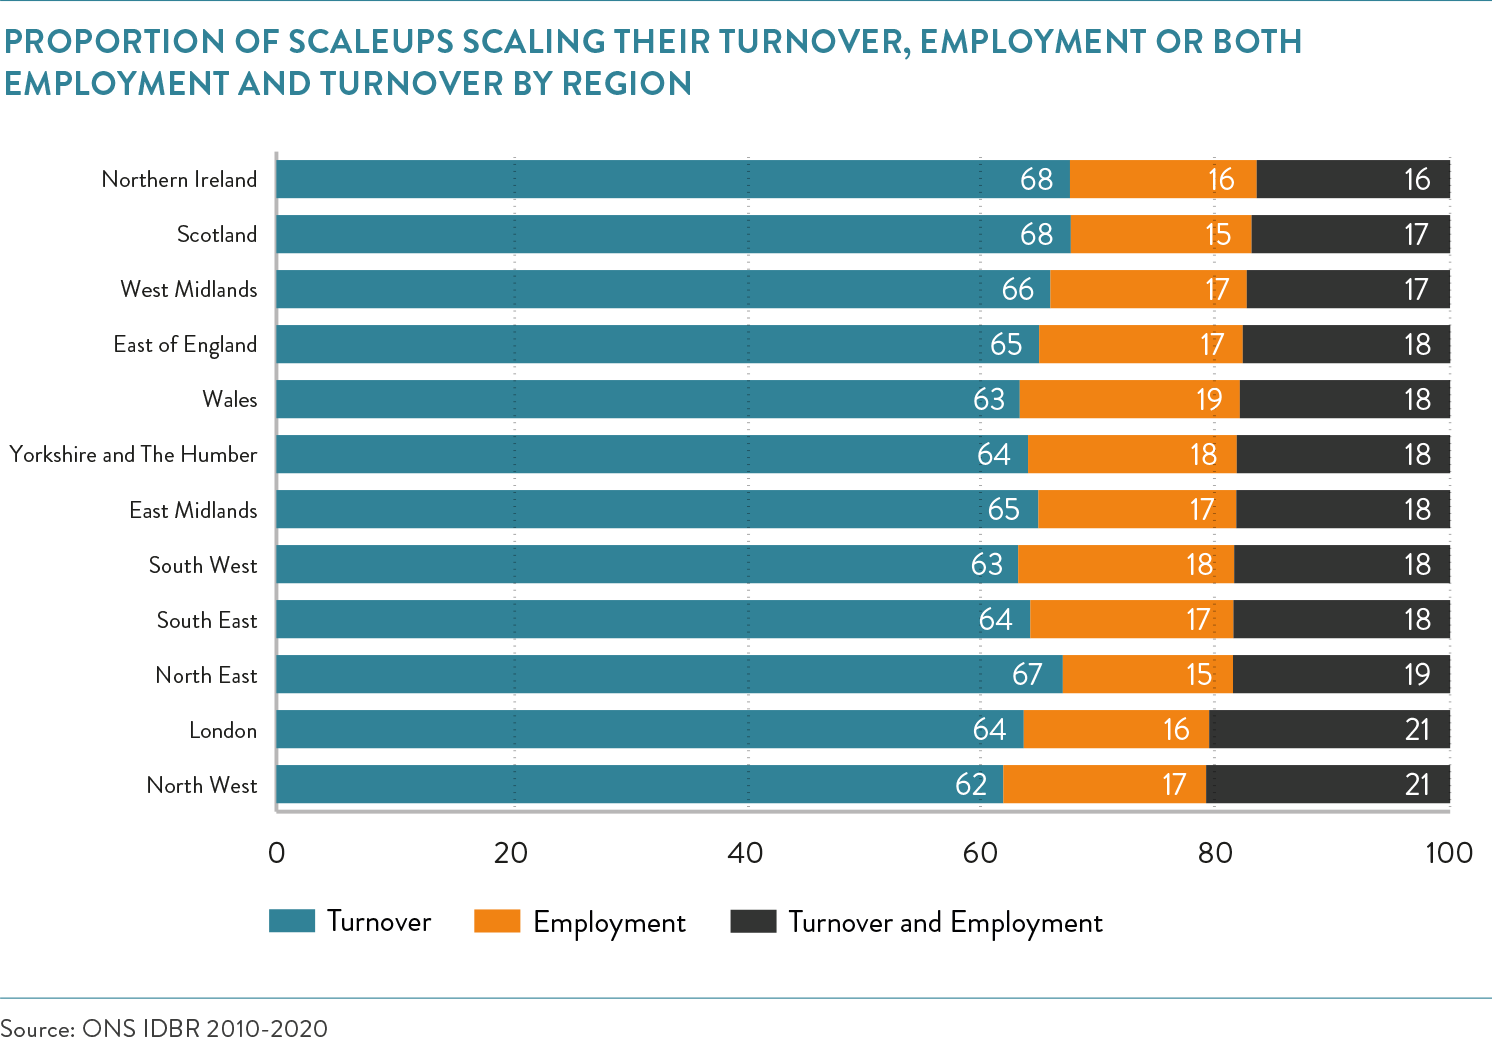
BY REGION
All regions are broadly consistent in their composition of scaleups growing by turnover, employment or both. 50% of the scaleups that scaled in employment have also scaled by turnover across all regions.
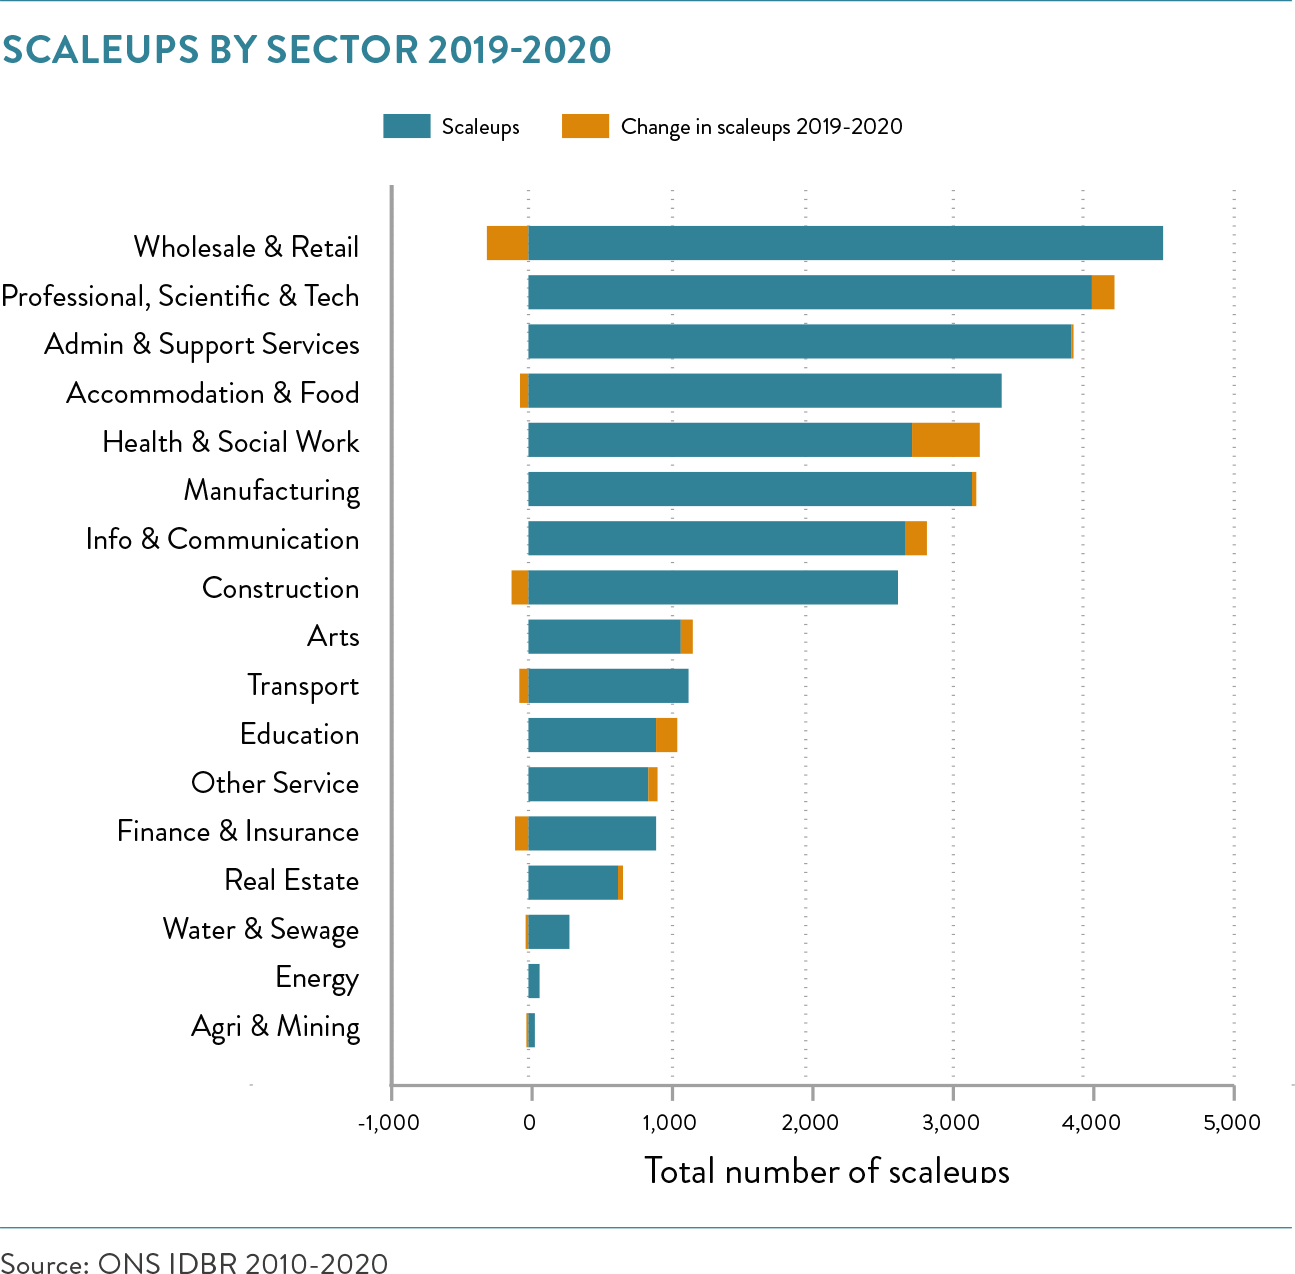
Scaleups reach out across the entire economy
The five sectors which showed the greatest percentage growth in scaleups from 2019 to 2020 were Health & Social Work; Education; Creative/Arts; Information & Communication; and Professional, Scientific & Technical. The Health & Social Work sector saw the biggest absolute gains in the number of scaleups in 2020 by 18%.
The largest four sectors by numbers of scaleups remain the same in 2020 as in 2019, being Wholesale & Retail, Professional, Scientific & Technical, Admin & Support services and Accomodation and Food. Although two of these four sectors – Wholesale & Retail, and Accommodation & Food Services – declined in numbers from the previous year.
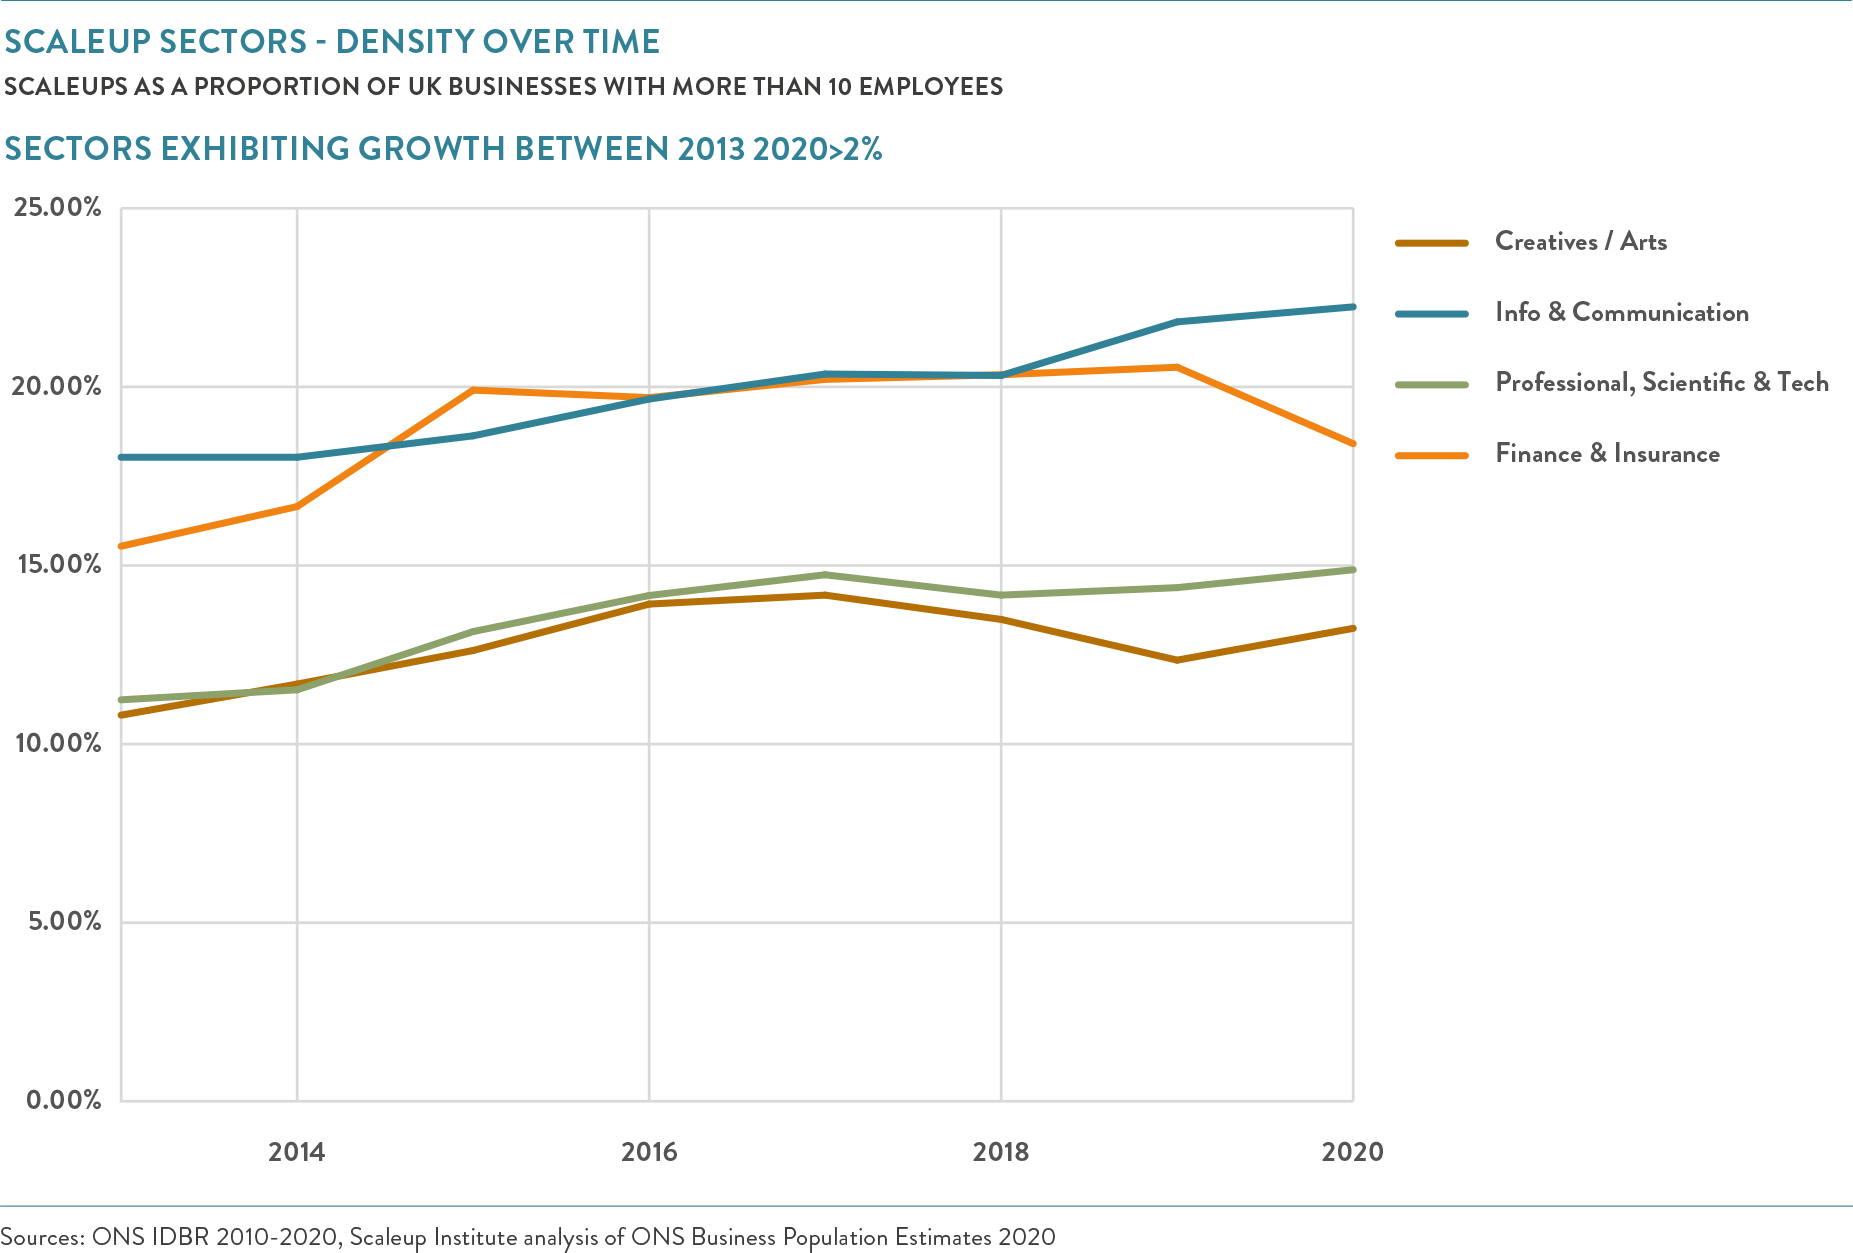
SECTORAL TRENDS OVER TIME
For the first time in 2022 we have looked at the proportion of scaleups to all UK businesses with minimum 10 employees and examined how this has changed between 2013 and 2022 to understand the varying time trends that sectors exhibit.
Creative, Info & Communication, Professional, Scientific & Tech and Finance & Insurance are 4 sectors that have shown steady growth as a proportion of all businesses with more than 10 employees since 2013. Finance & Insurance has seen a slight dip between 2019 and 2020.
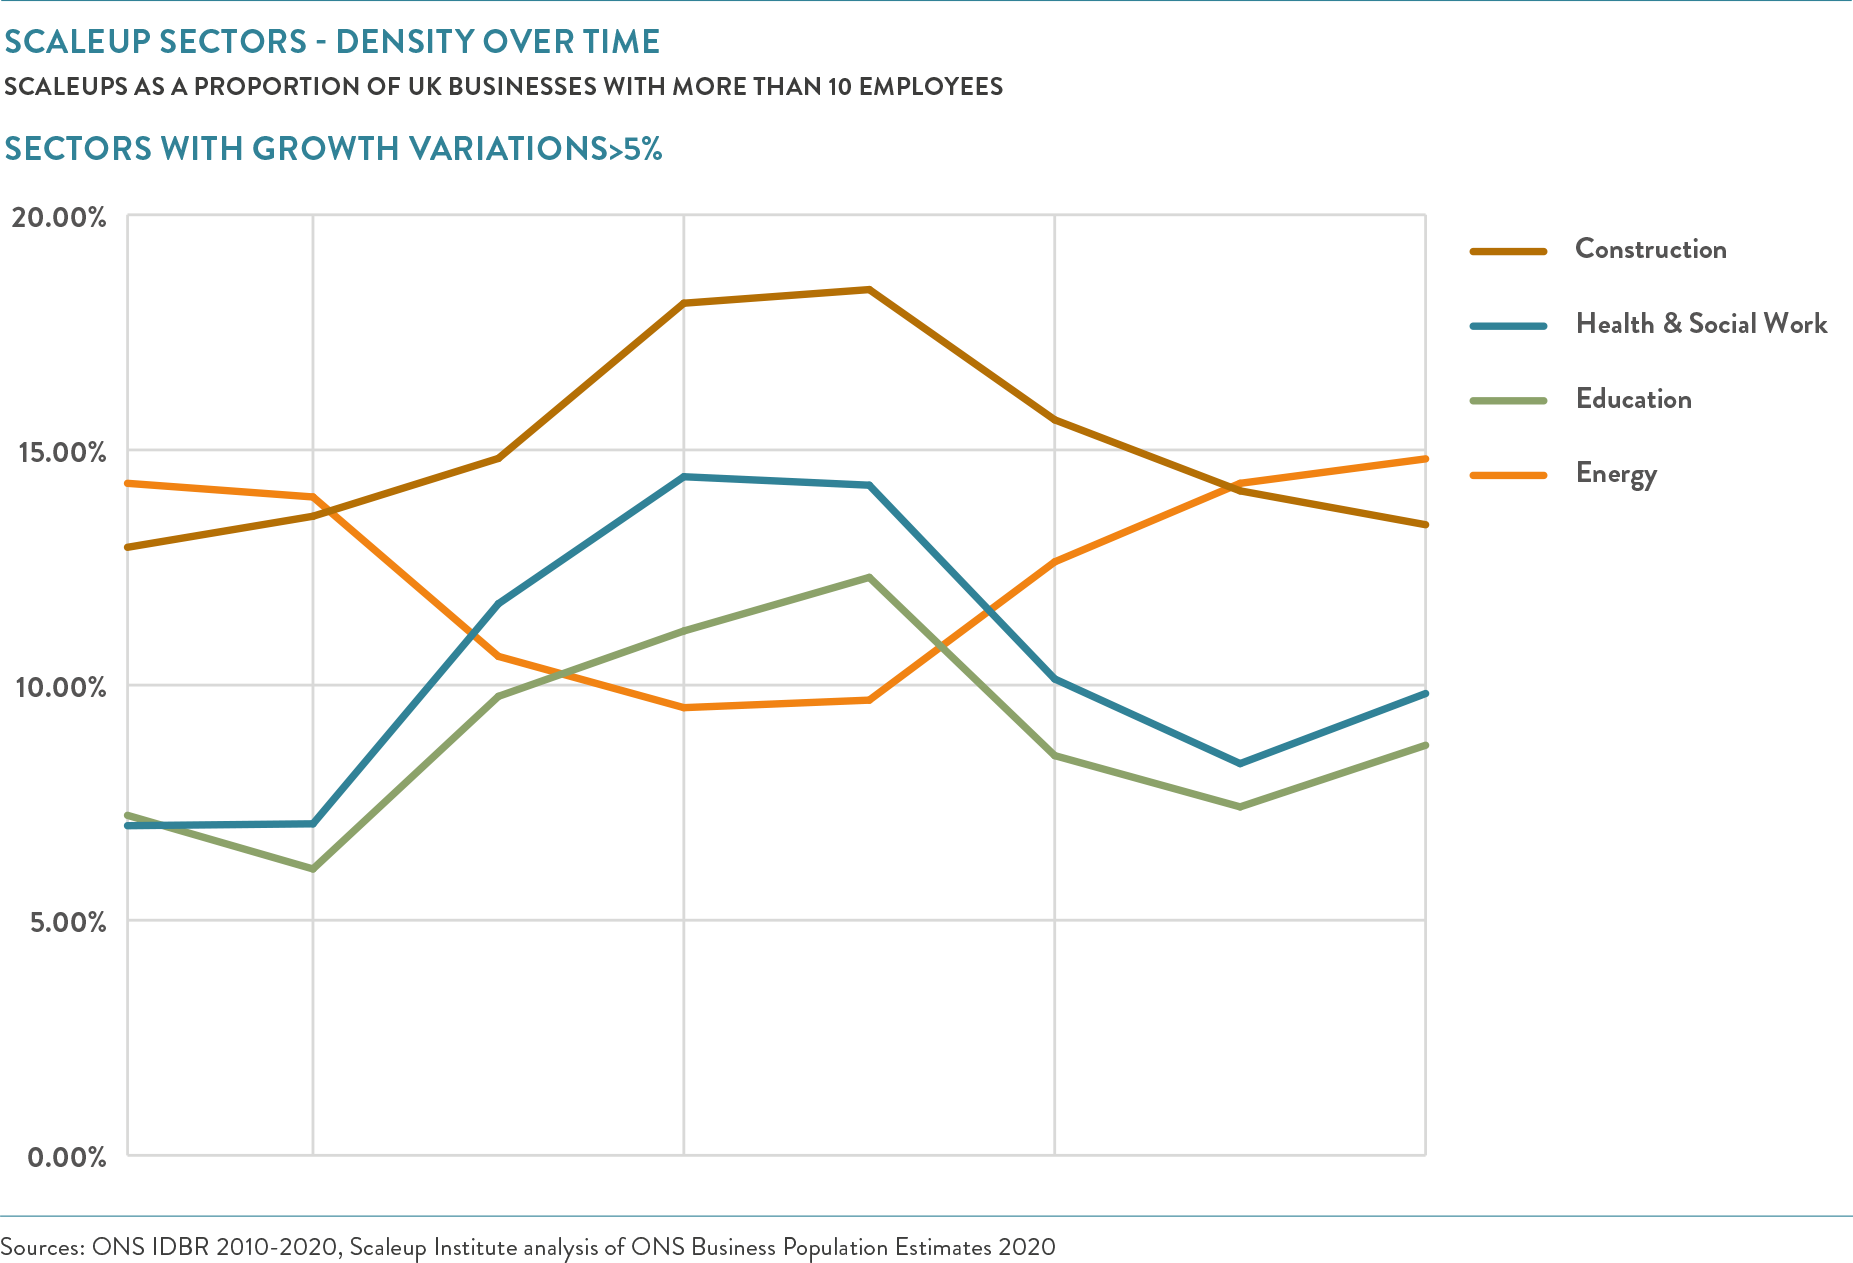
The proportions of Health & Social Work and Education sector scaleups have also grown since 2013 but are still at a lower level than their peak in the 2016-2017 period. They have shown volatile growth patterns – as have Construction and Energy.
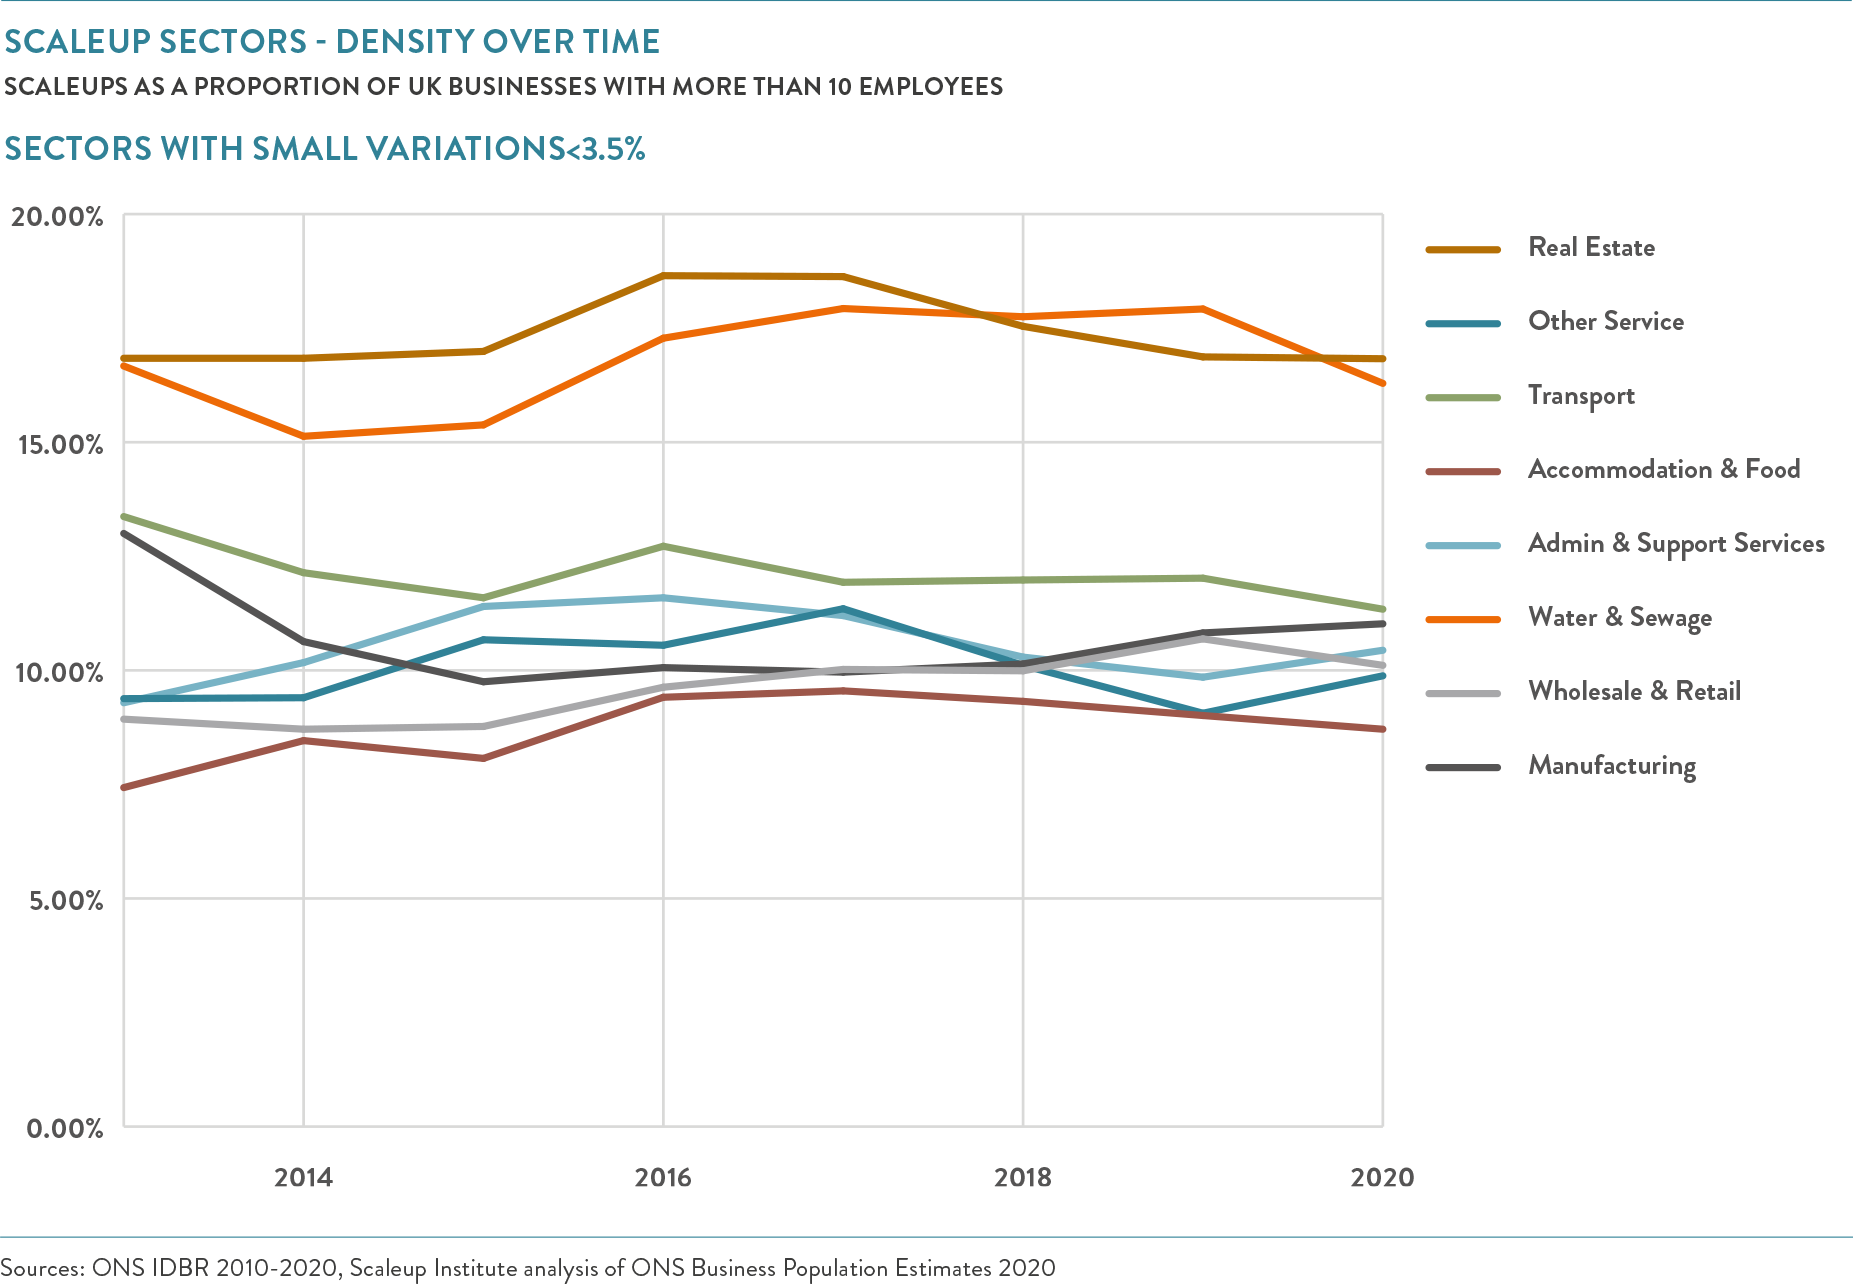
8 out of the 12 sectors show a stable trend with minor ups and downs year on year – less than 3.5% variation in relation to their peers across the economy.
In almost all scaleup sectors we have seen an increase in absolute numbers with the largest gains in the Professional, Scientific & Technical sector, followed by Accommodation & Food Services, Information & Communication, and Health & Social Work.
CONTENTS

Introduction 2022

Chapter 1 2022
The ScaleUp Business Landscape

Chapter 2 2022
Leading Programmes Breaking Down the Barriers for Scaleups

Chapter 3 2022
The Local Scaleup Ecosystem

Chapter 4 2022
The Policy Landscape

Chapter 5 2022
Looking forward

Annexes 2022

SCALEUP STORIES 2022


 Previous

Share