Explore the ScaleUp Annual Review 2020
Select a section to expand and explore this year's review..
CONTENTS
Introduction 2020
Chapter 1 2020
The Scaleup business landscape
Chapter 2 2020
Leading Programmes Breaking Down the Barriers for Scaleups
Chapter 3 2020
The local scaleup ecosystem
Chapter 4 2020
Shaping policy to foster UK scaleups: Breaking down barriers
Chapter 5 2020
Looking Forward
Scaleup Stories 2020
Annexes 2020
Scaleup indicators from a national and local perspective
At the core of the ScaleUp Institute’s mandate is working collaboratively to progress and share the evidence about the scaleup business ecosystem in the UK. Accurate and timely analysis of data from new and existing sources, can help local communities and authorities, LEPs, regions, and stakeholders from the private and third sector to better position interventions removing the barriers to scaleup growth.
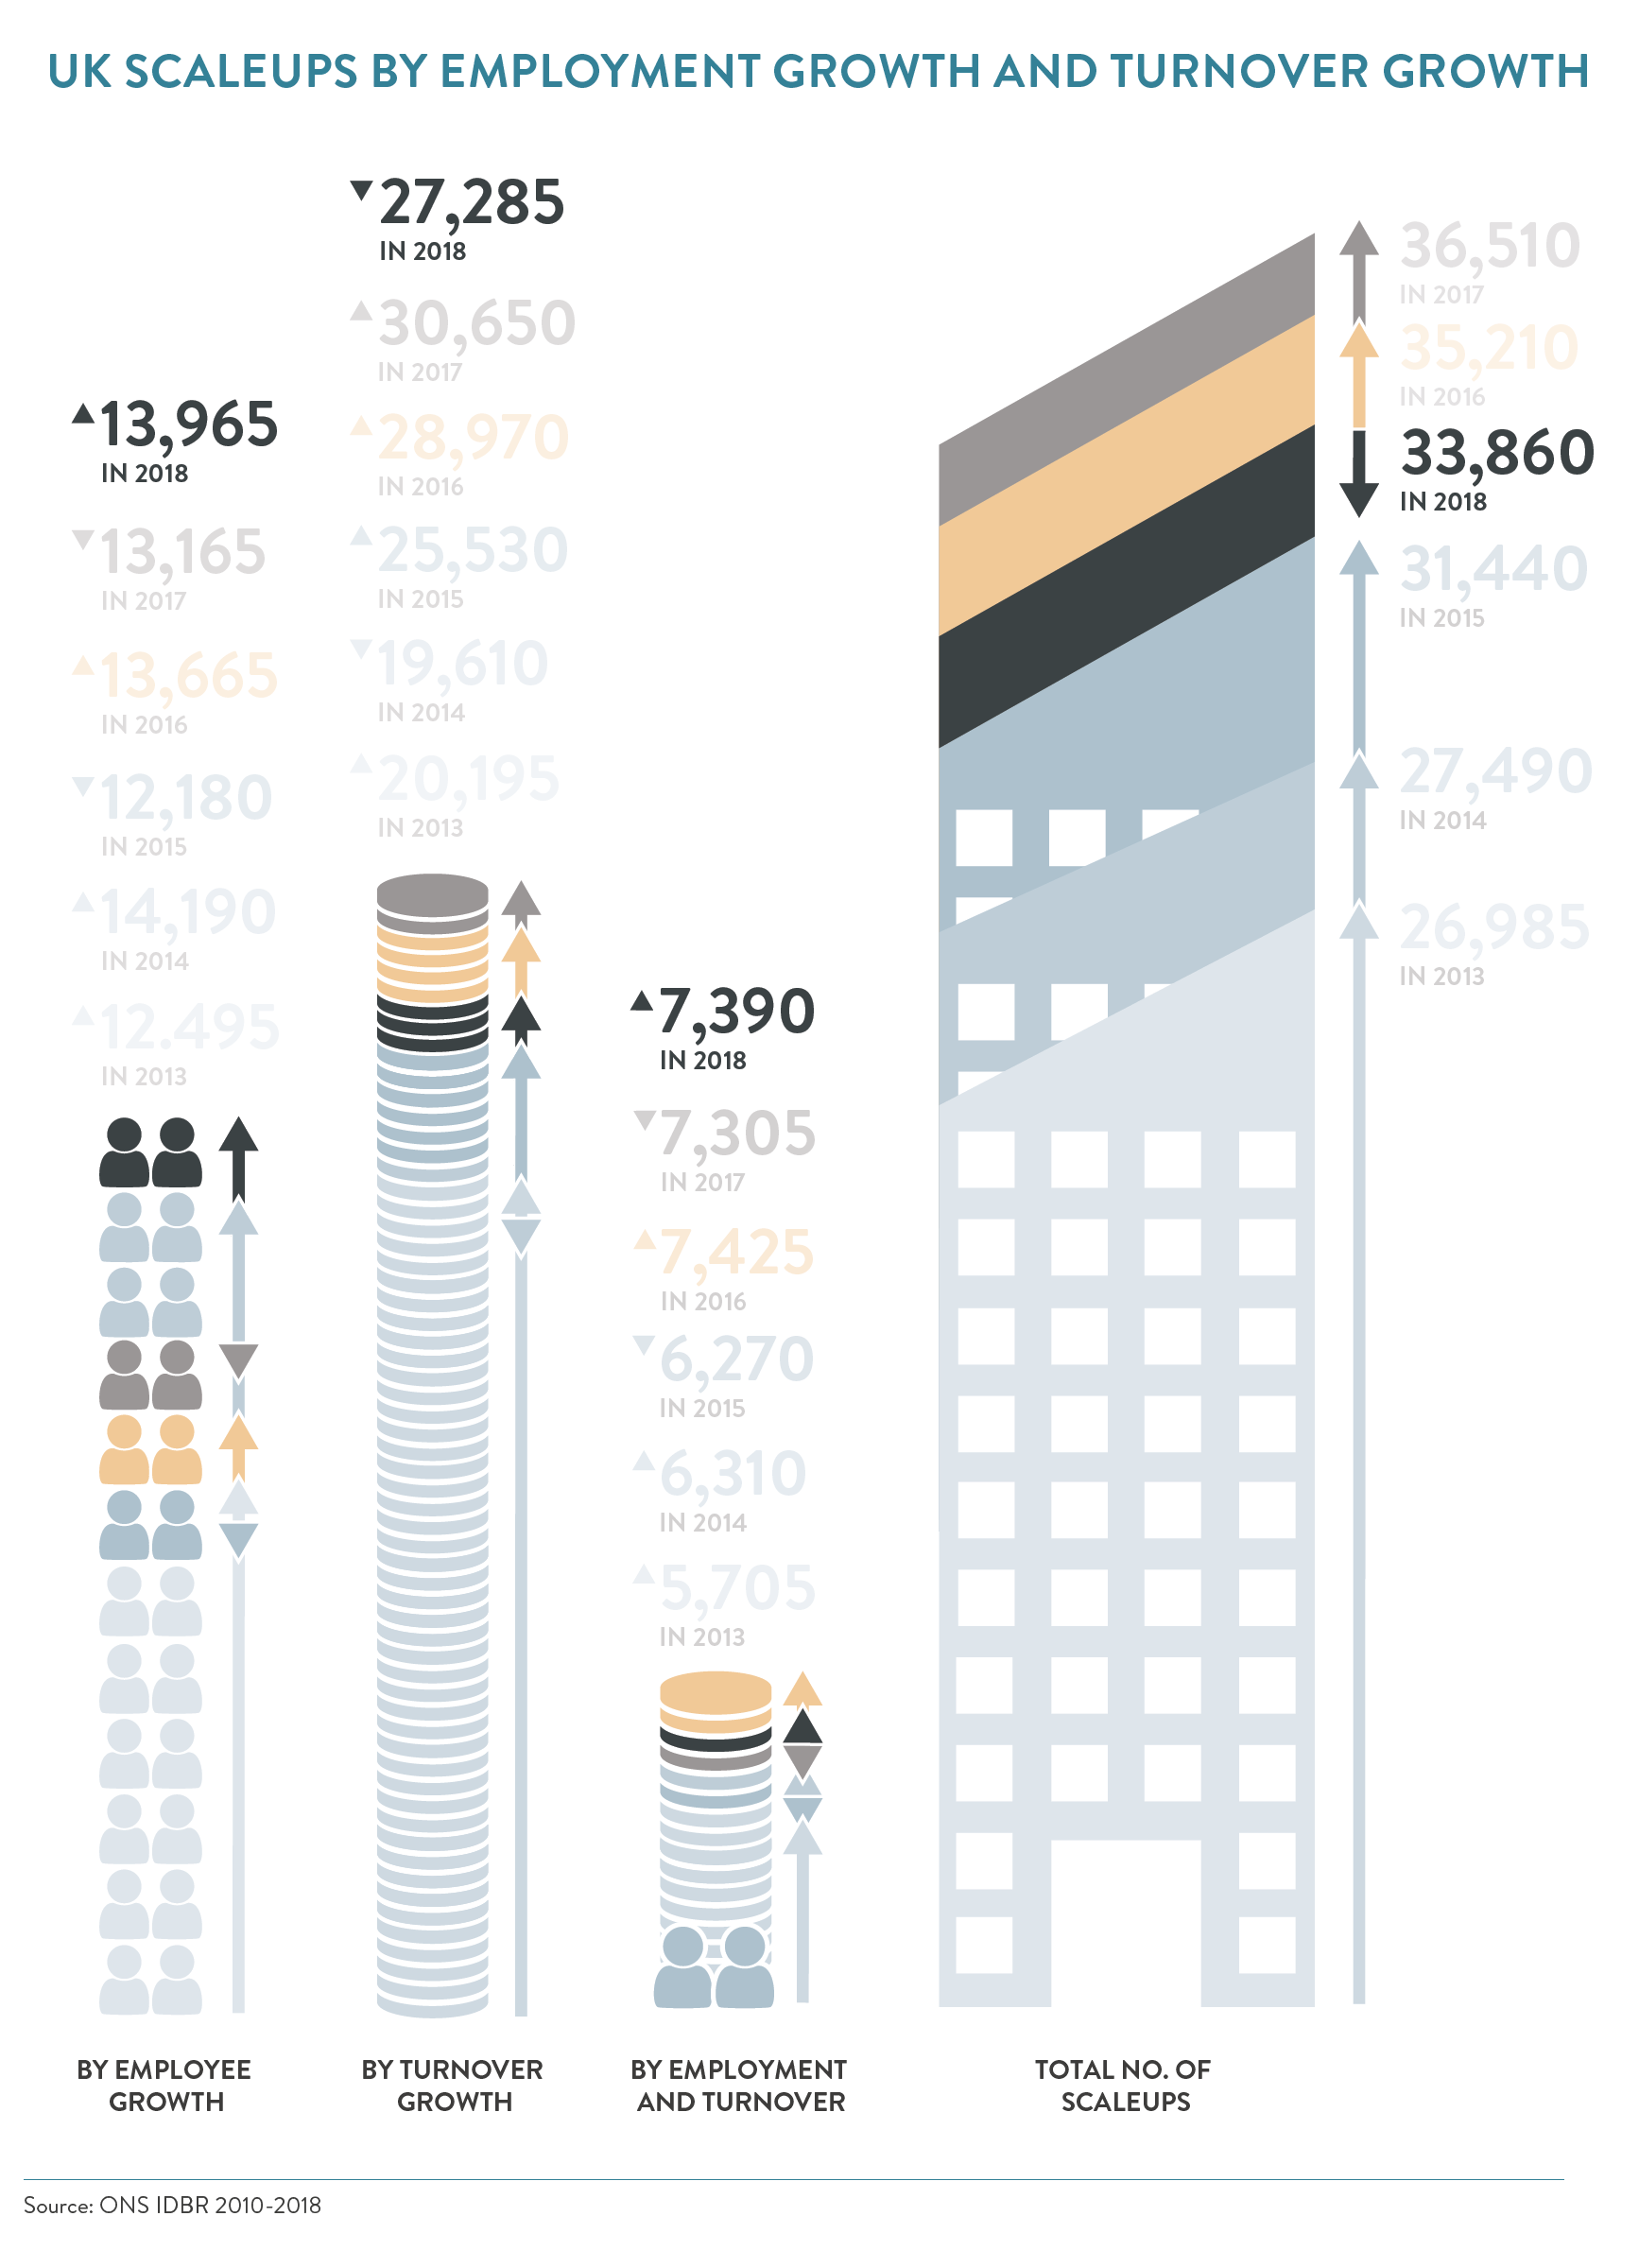
The ScaleUp Institute with the collaboration of the Office for National Statistics has undertaken a detailed analysis of the ONS 2018 data – the most recent available – against three elements of the OECD high-growth (scaleup) definition1. These include the following:
- Scaleups growing by more than 20% per annum by employee growth
- Scaleups growing by more than 20% per annum by turnover growth
- Scaleups growing by more than 20% per annum in both employees and turnover.
In August, we published our third annual ONS ScaleUp Landscape report, presenting our analysis of scaleup growth and performance both national and local, based on ONS 2018 data. Alongside our analysis of the scaleup ecosystem in the UK this year, for the first time, we have also taken a view on a substantial group of scaling businesses that fall just outside the threshold of scaleup growth by growing their turnover and/or employee headcount between 15 and 19.99%. These businesses form part of the scaling pipeline.
Understanding what drives local scaleup growth has also been a focus of the ScaleUp Institute in 2020. The outcome of our quantitative and qualitative research is outlined below.
The ScaleUp Landscape
In 2018, there were 33,860 scaleups in the UK. The total number of scaleups has fallen since 2017, resulting from an 11% drop in the number scaling by turnover, a risk we signalled in our 2019 Annual Review. This may reflect the ongoing uncertain economic conditions following the UK’s decision to leave the EU in 2016 and increasing barriers for scaleups to access markets at home and abroad as signalled by the annual ScaleUp Survey in recent years. However, despite the decline in the number of turnover scaleups, the total number of scaleups is 25% higher than it was in 2013. Furthermore, there were 13,965 scaleups growing by employment and 7,390 scaleups growing by both turnover and employment, indicating an increase of 6.1% and 1.2% respectively.
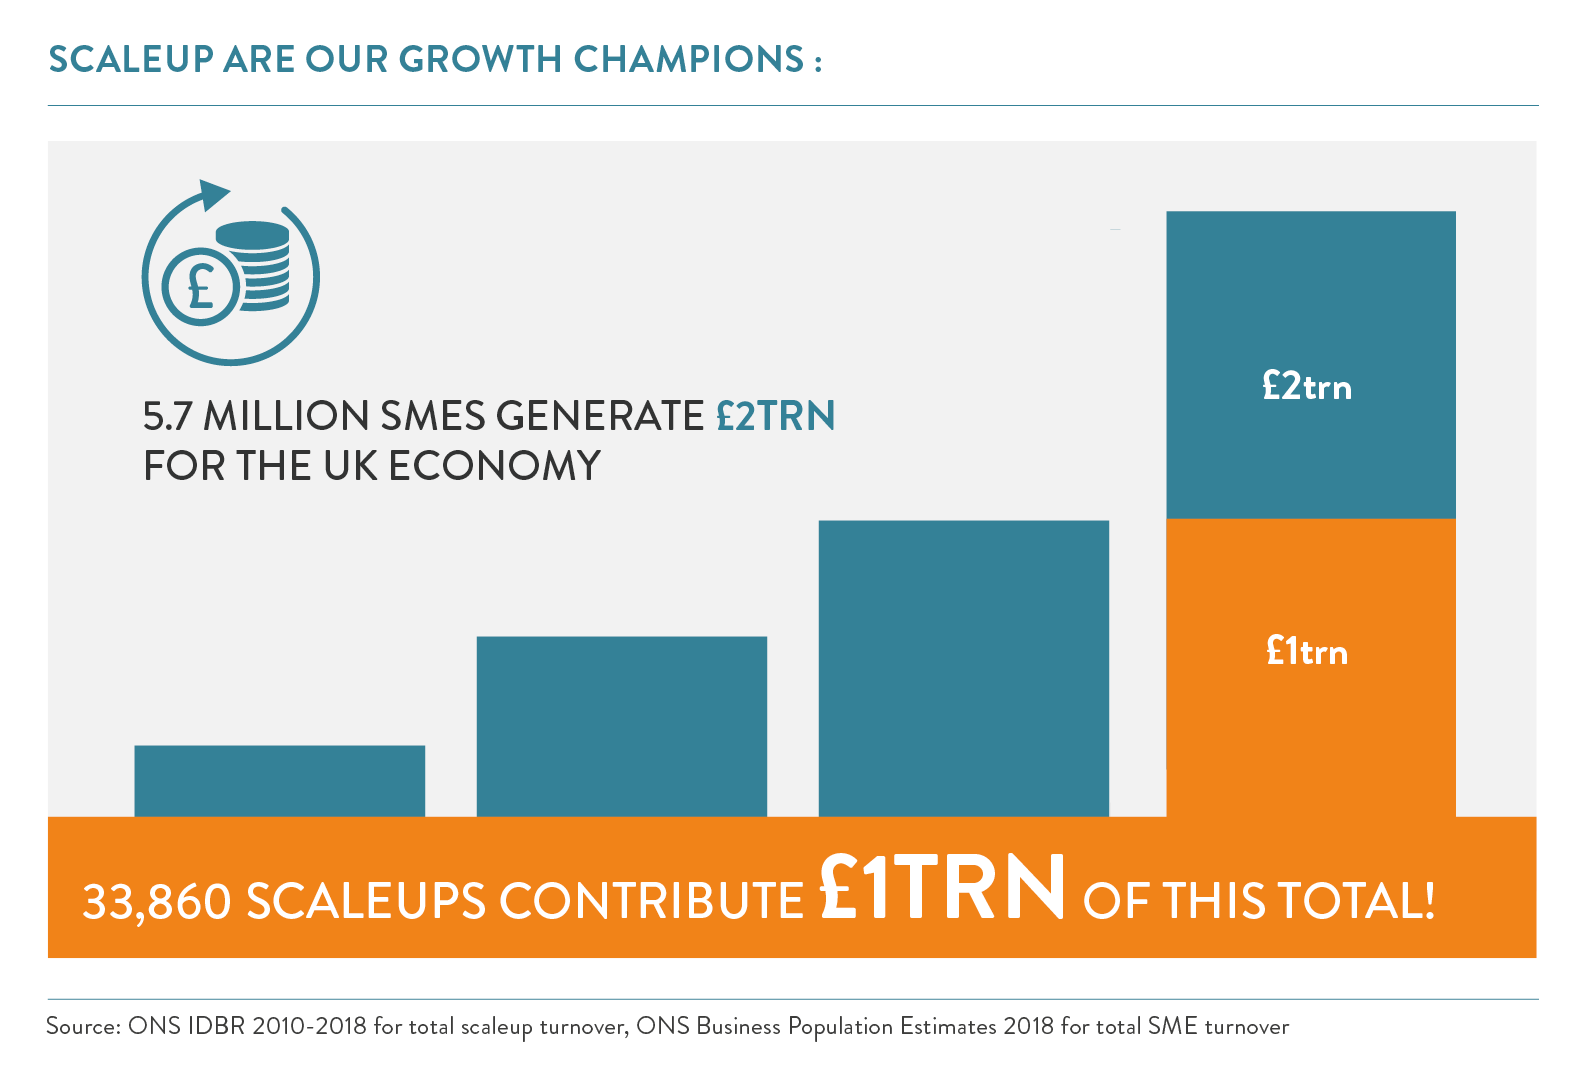
Scaleups continue to be the most innovative and international of our SMEs, generating a total turnover of £1 trillion – a 50% of the total contribution by all UK SMEs and are 54% more productive than their peers. Encouragingly, we continue to see scaleup numbers increase across the breadth of the economy, benefiting it as a whole, as they operate across all sectors, geographies and are an important driver of local employment.
Scaleup remain the growth champions of SMEs but there is no room for complacency
The value scaleups contribute to the UK economy remains substantial. In 2018, scaleups employed 3.5 million people and generated a total turnover of £1 trillion for the UK economy – for an average turnover per employee of £286,000. Scaleups represent 50% of the total SME turnover output despite making up less than 1% of the SME population: emphasising the critical need for segmentation and tailored policy, solutions and services for scaling firms in our public, private and education sectors. The average turnover per scaleup was £29.5m.
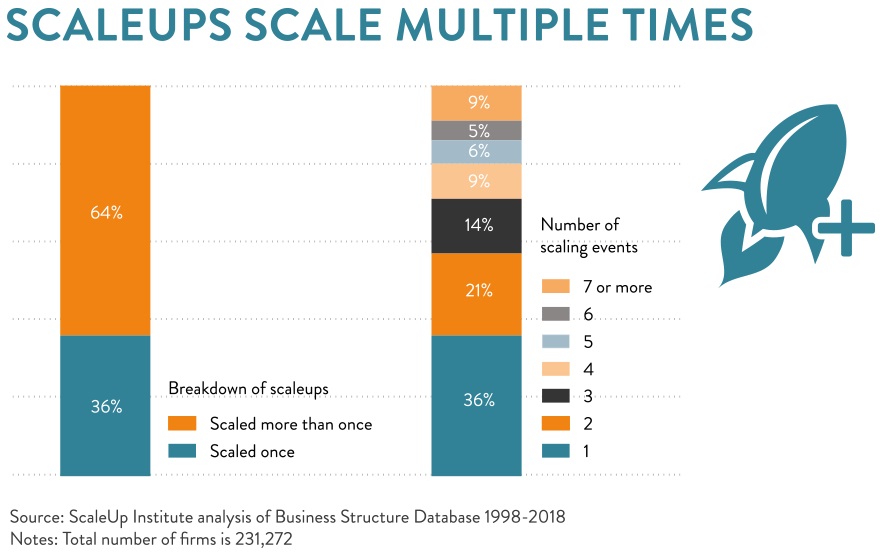
Scaleups keep scaling: businesses that scale are more likely to grow in the future
Our analysis in 2019 of ONS data showed that two thirds of scaleups have scaled more than once, half of these have scaled four or more times (29%). Trends indicate that most employment scaleups have also scaled their turnover. Three quarters of employment scaleups also scaled turnover at least once over the period – however the same was not true of turnover scaleups, where a lower proportion scaled employment.
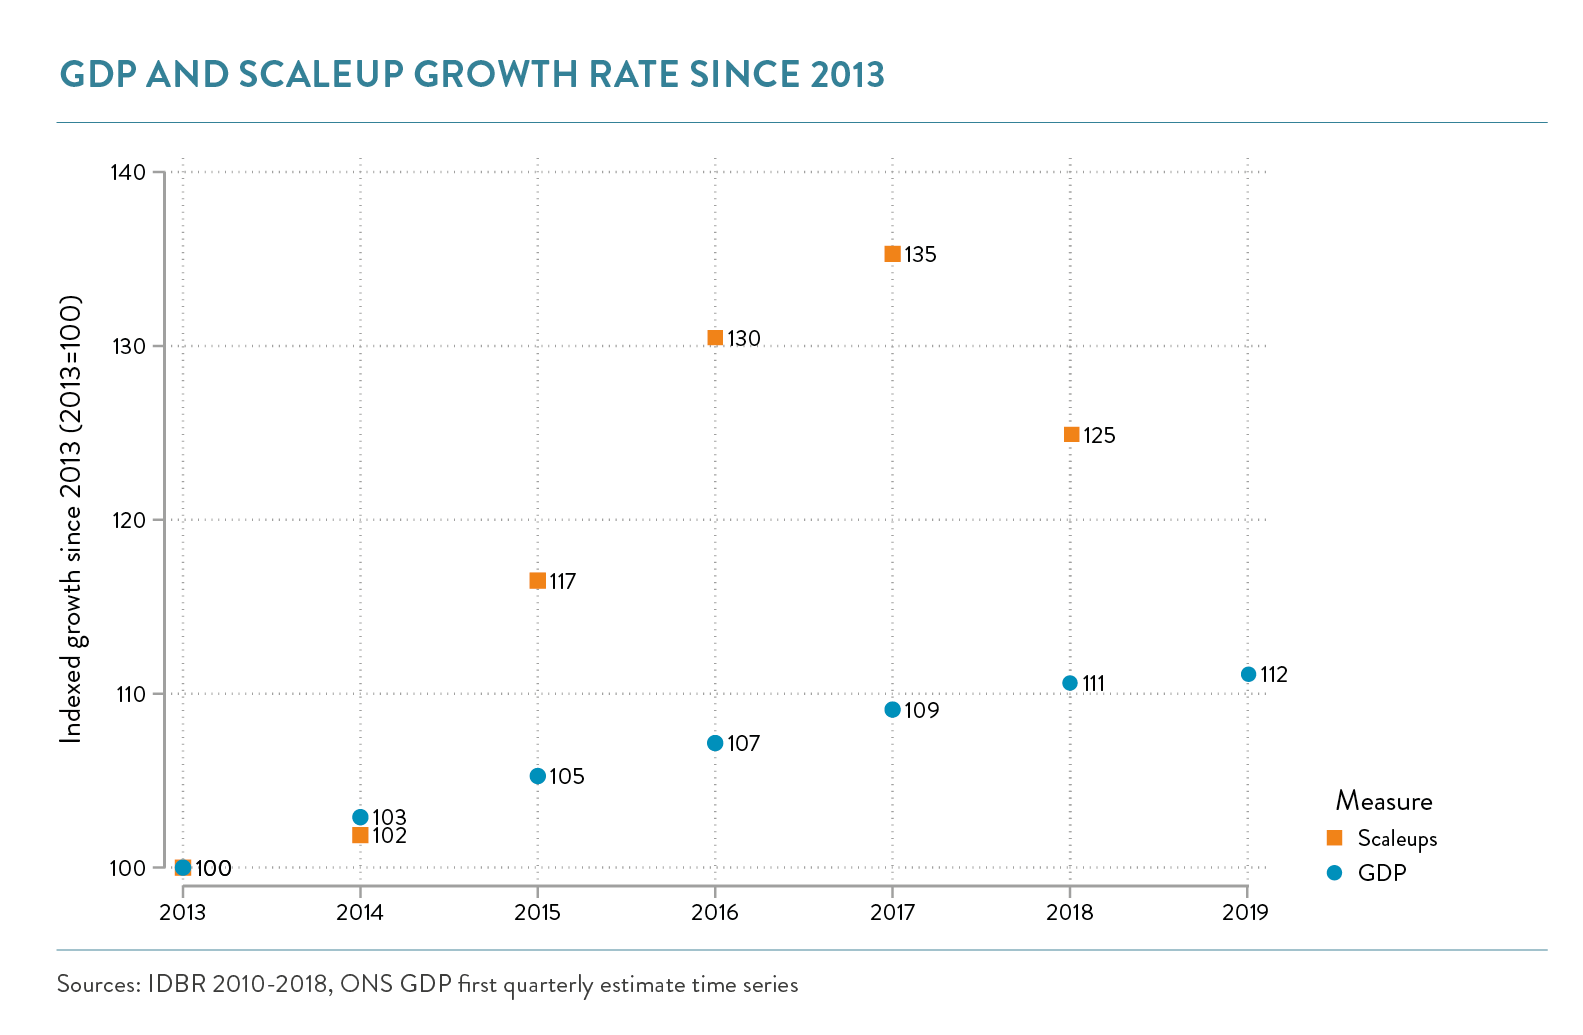
Scaleups Outstrip GDP
As mentioned above, the total scaleups number is 25% above the 2013 total and from 2013 up to 2018, they have surpassed the economy and other SMEs – outstripping growth by 13% and 8% respectively.
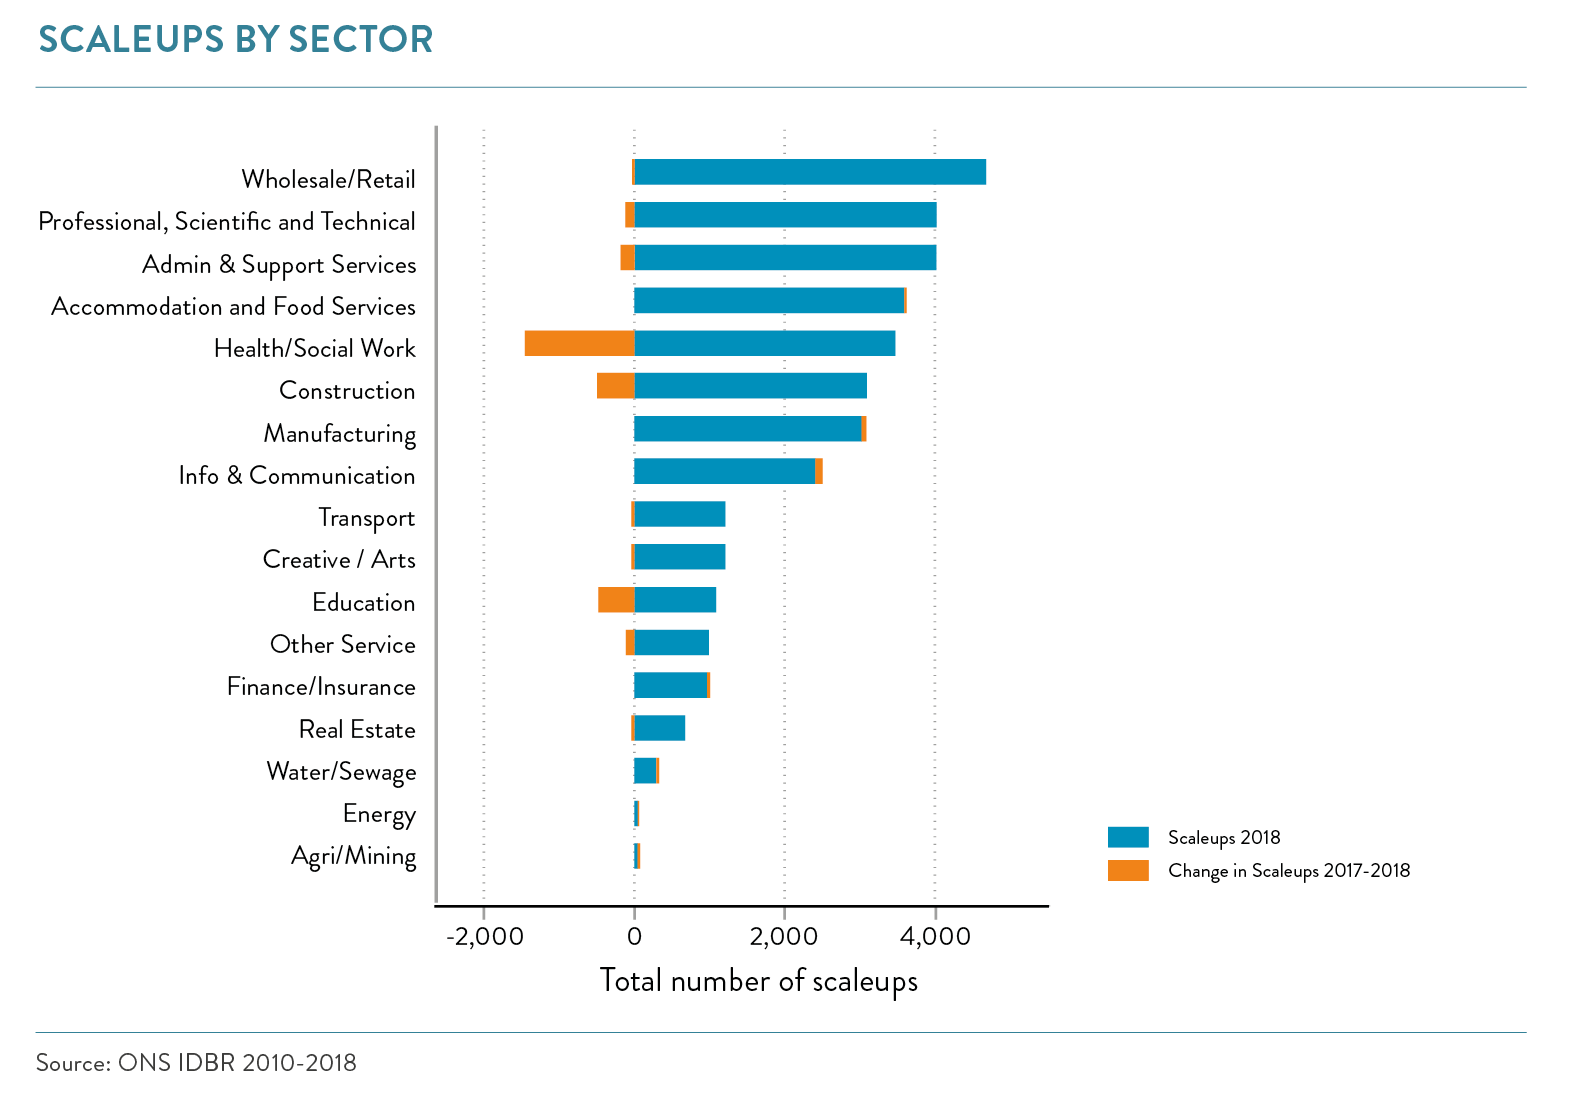
Scaleups are across all sectors of the economy
Scaleups exist in all sectors of the economy. The ONS data shows that the largest five sectors by scaleup count in 2018 remain the same as for 2017 – although their order has changed. Wholesale/retail has become the largest sector and the professional, scientific and technical has moved up from fourth place in 2017 to the second largest sector in 2018. The health/ social work sector shows the biggest decline; it was the largest sector for scaleups in 2017. The sectors which show the largest increases in scaleup numbers are manufacturing, and information & communications.
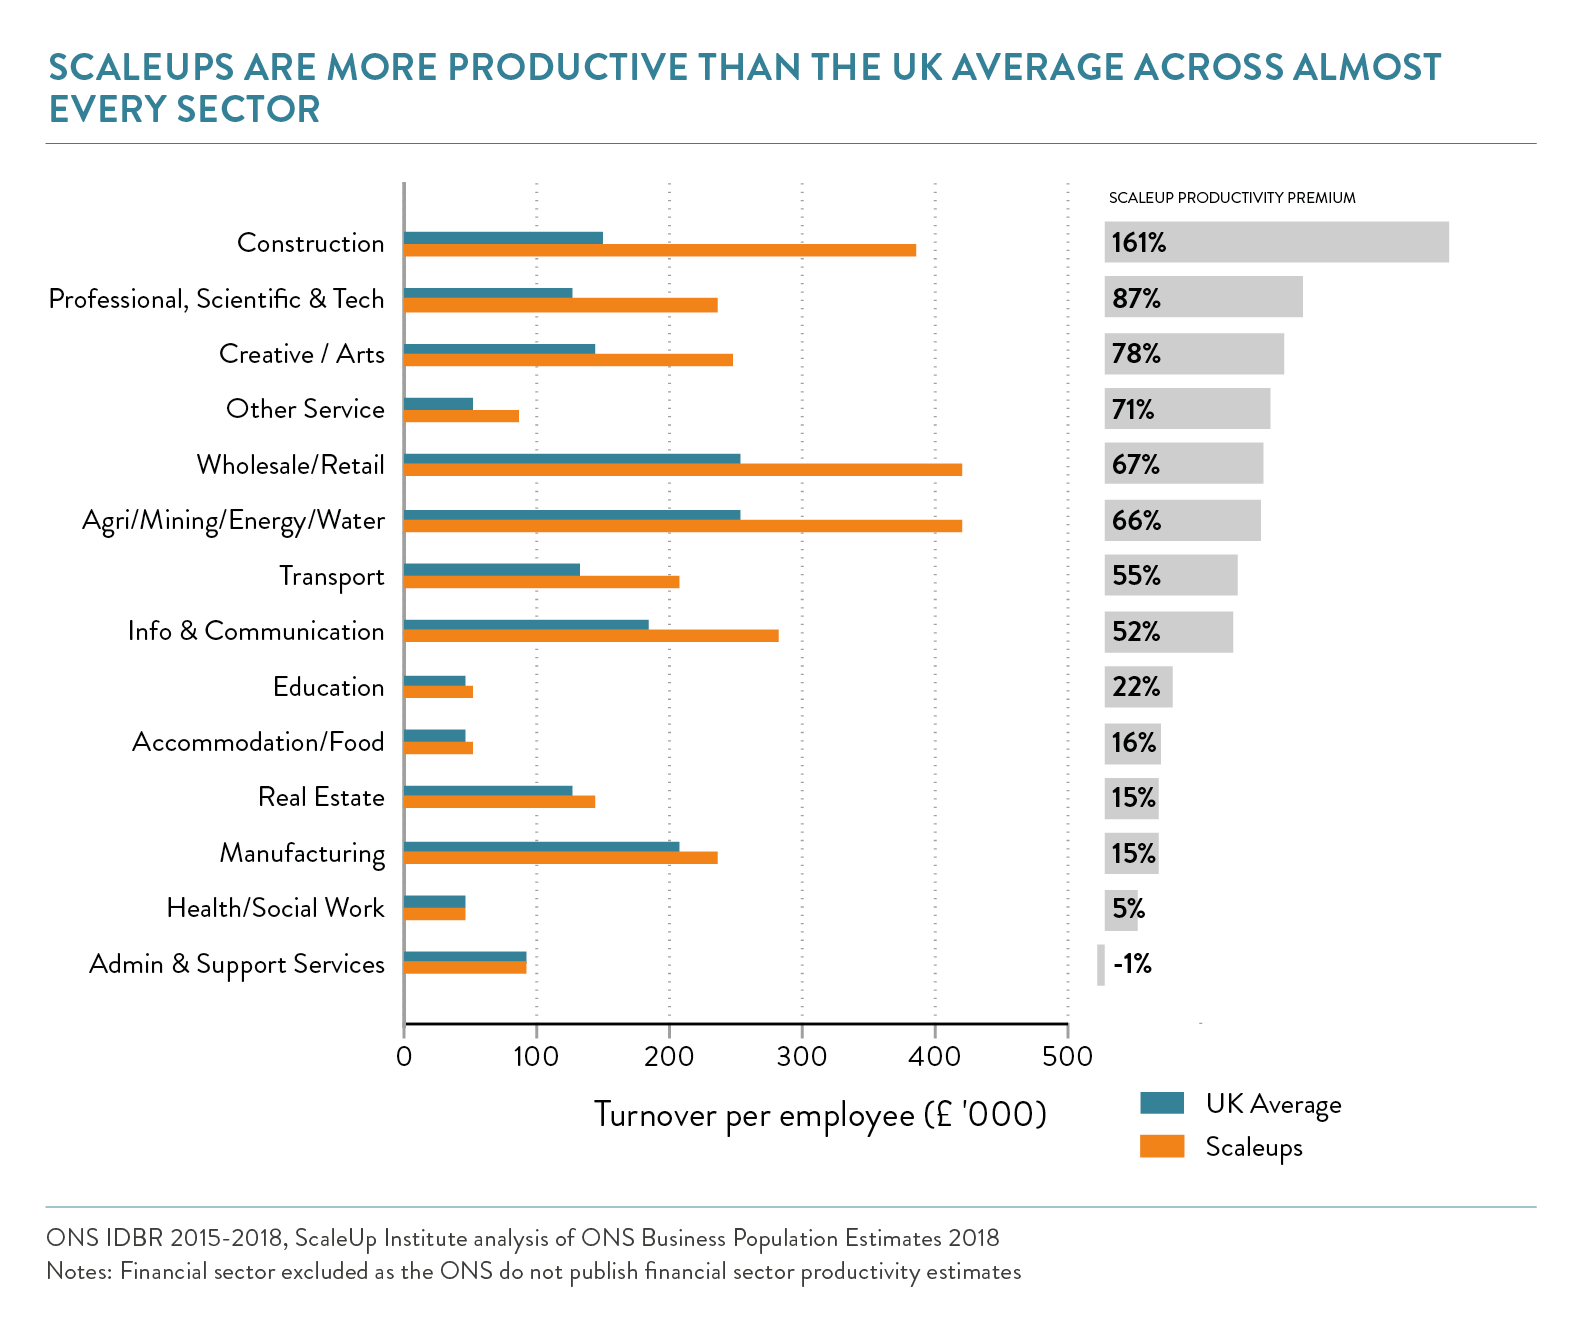
Powerhouses of productivity
Scaleups continue to be more productive than other UK businesses across almost every sector of the economy. The average productivity rose significantly in 2018. The premium of scaleups across all sectors was 54%, compared to 42% last year2. The sectors that scaleups outperformed remarkably their peers are: Construction; Professional, scientific & tech; and Creative, being 161%, 87% and 78% more productive respectively.
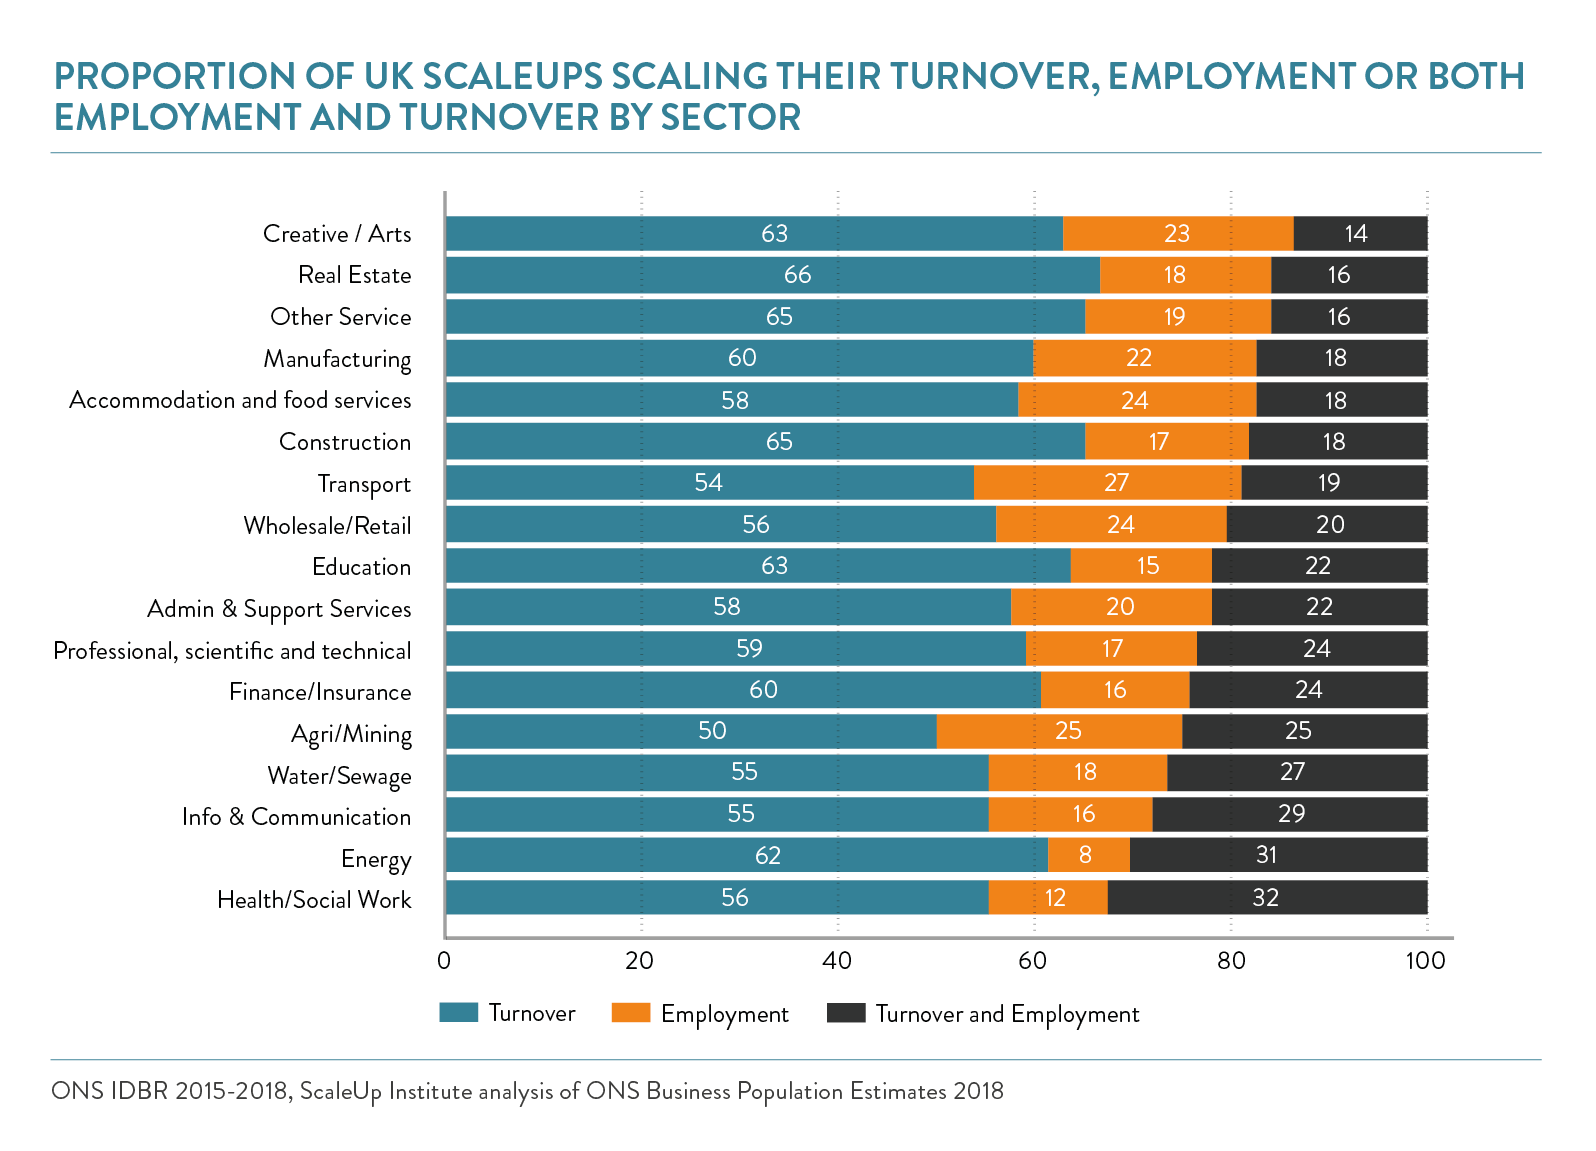
Patterns of Growth
Overall, 59% of scaleups are scaling by turnover, 22% by employment and turnover, and 19% by employment exclusively. There is little variation among sectors in the proportion of scaleups scaling by turnover exclusively. However, for those scaling by both turnover and employment and those scaling by employment exclusively considerable variations are seen.
LOCAL ANALYSIS OF SCALEUP POPULATIONS AND GROWTH RATES
Levelling up must be a priority – local scaleup growth rates and trends
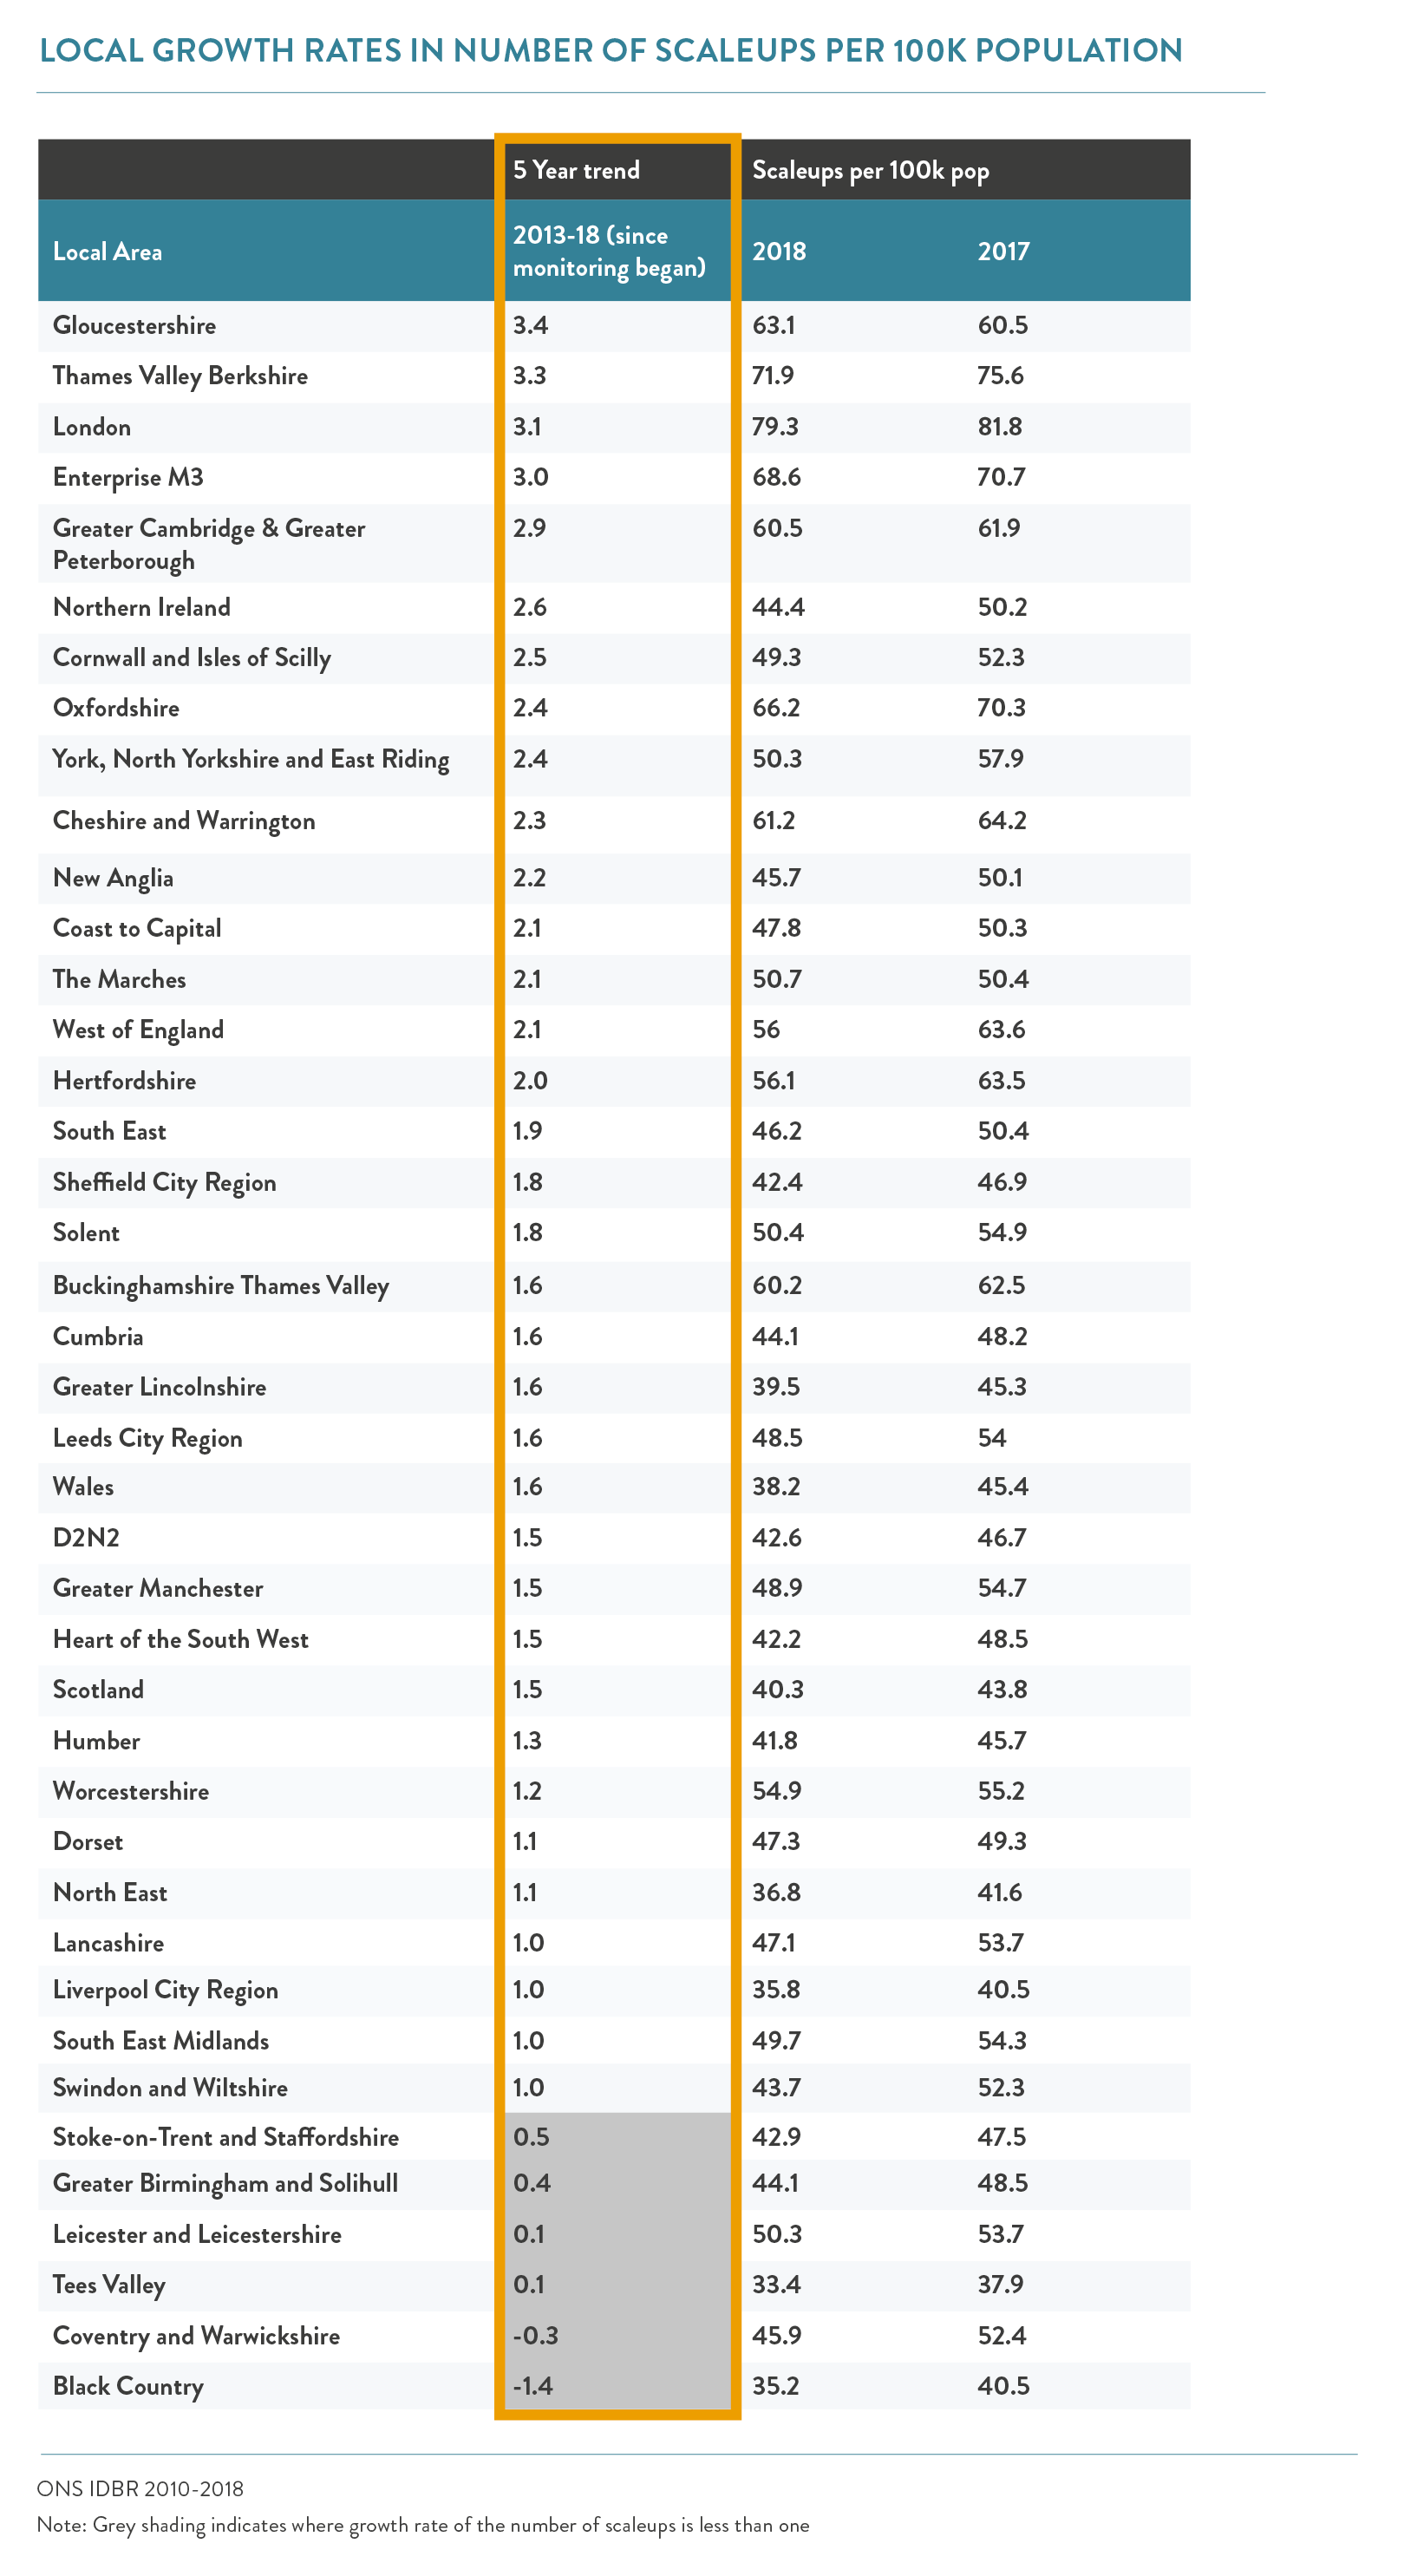
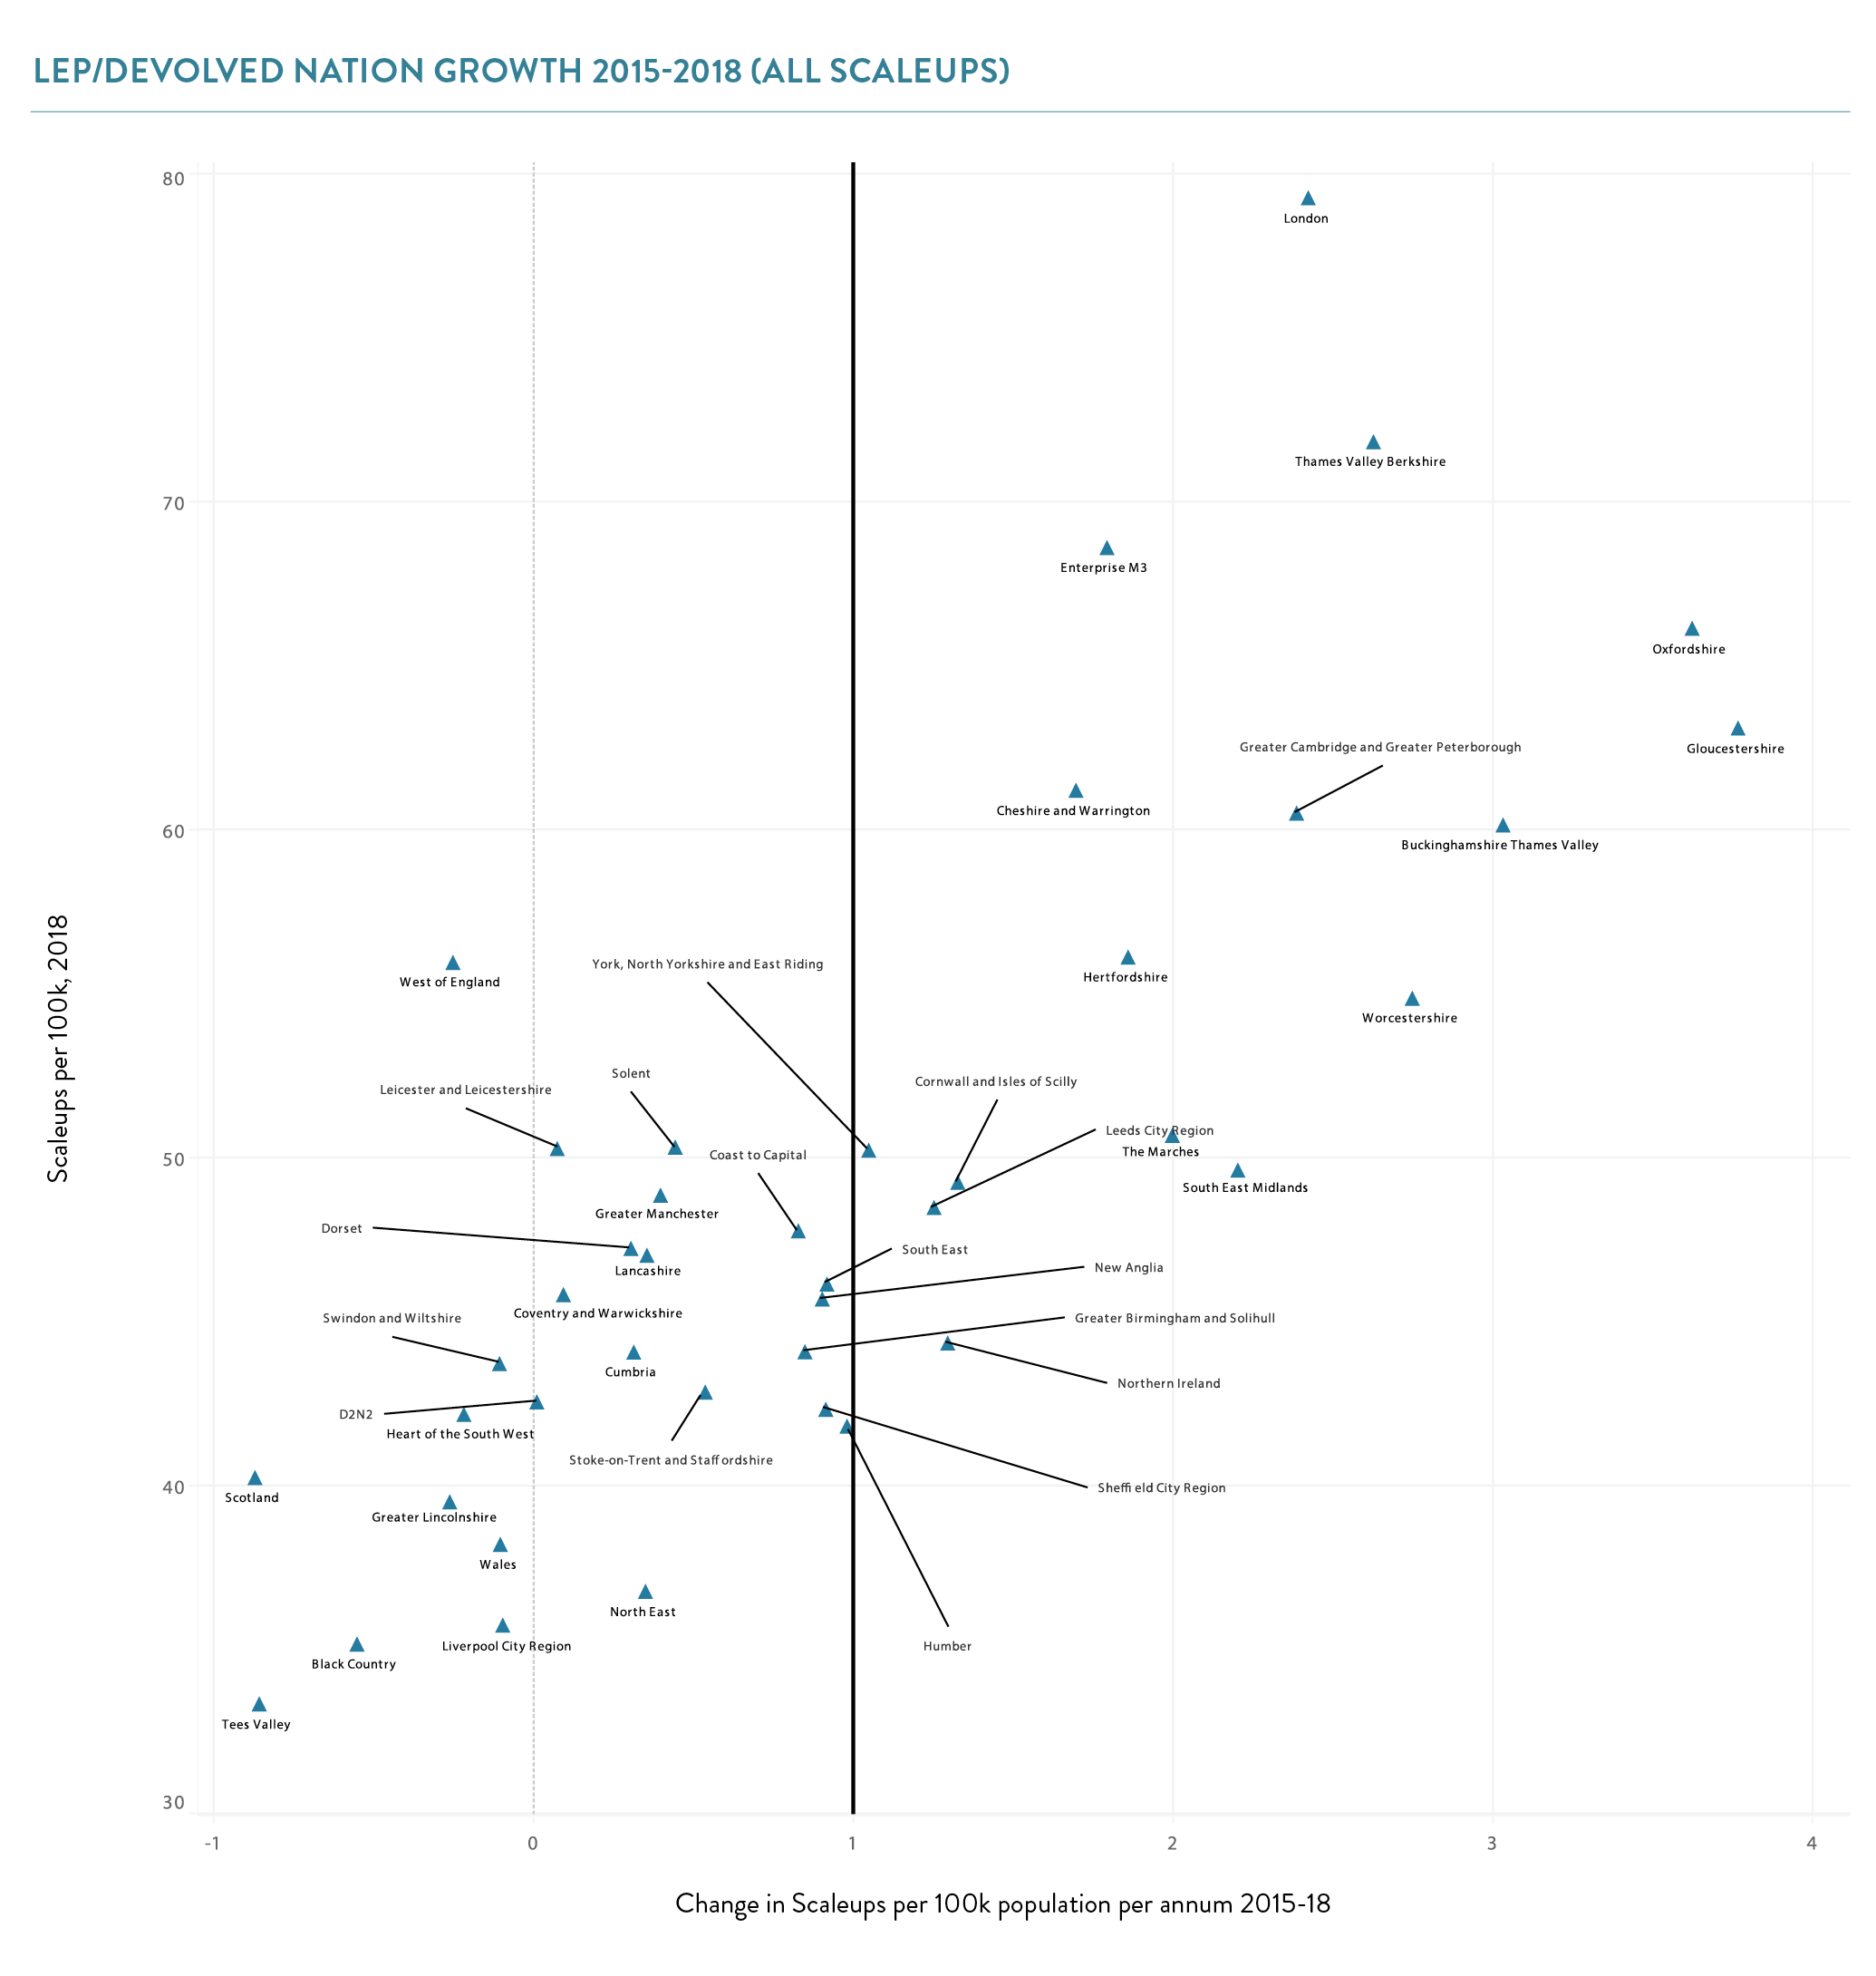
Across the 38 LEPs and three devolved nations, we can now look at a five-year time horizon since 2013, as well as the three-year rolling average.
Over the five-year monitoring period since 2013 (outlined in orange on the table below) a number of trends appear across local areas:
- 39 of the 41 LEPs/devolved nations grew in scaleups per 100,000 population.
- There were 15 areas where annual growth was greater than two additional scaleups per 100,000 population of which four grew faster than three additional scaleups per 100,000 population – Gloucestershire, Thames Valley Berkshire, London and Enterprise M3.
- In seven ‘cold spots’ growth was less than one additional scaleup per 100,000 population; these were Swindon and Wiltshire, Stoke-on-Trent and Staffordshire, Greater Birmingham and Solihull, Leicester and Leicestershire, Tees Valley, Coventry and Warwickshire, and Black Country.
- Of the top 10 growing areas between 2013 and 2018, five were also in the top 10 for the 2015-2018 ranking – Gloucestershire, Thames Valley Berkshire, London, Greater Cambridge and Greater Peterborough, and Oxfordshire.
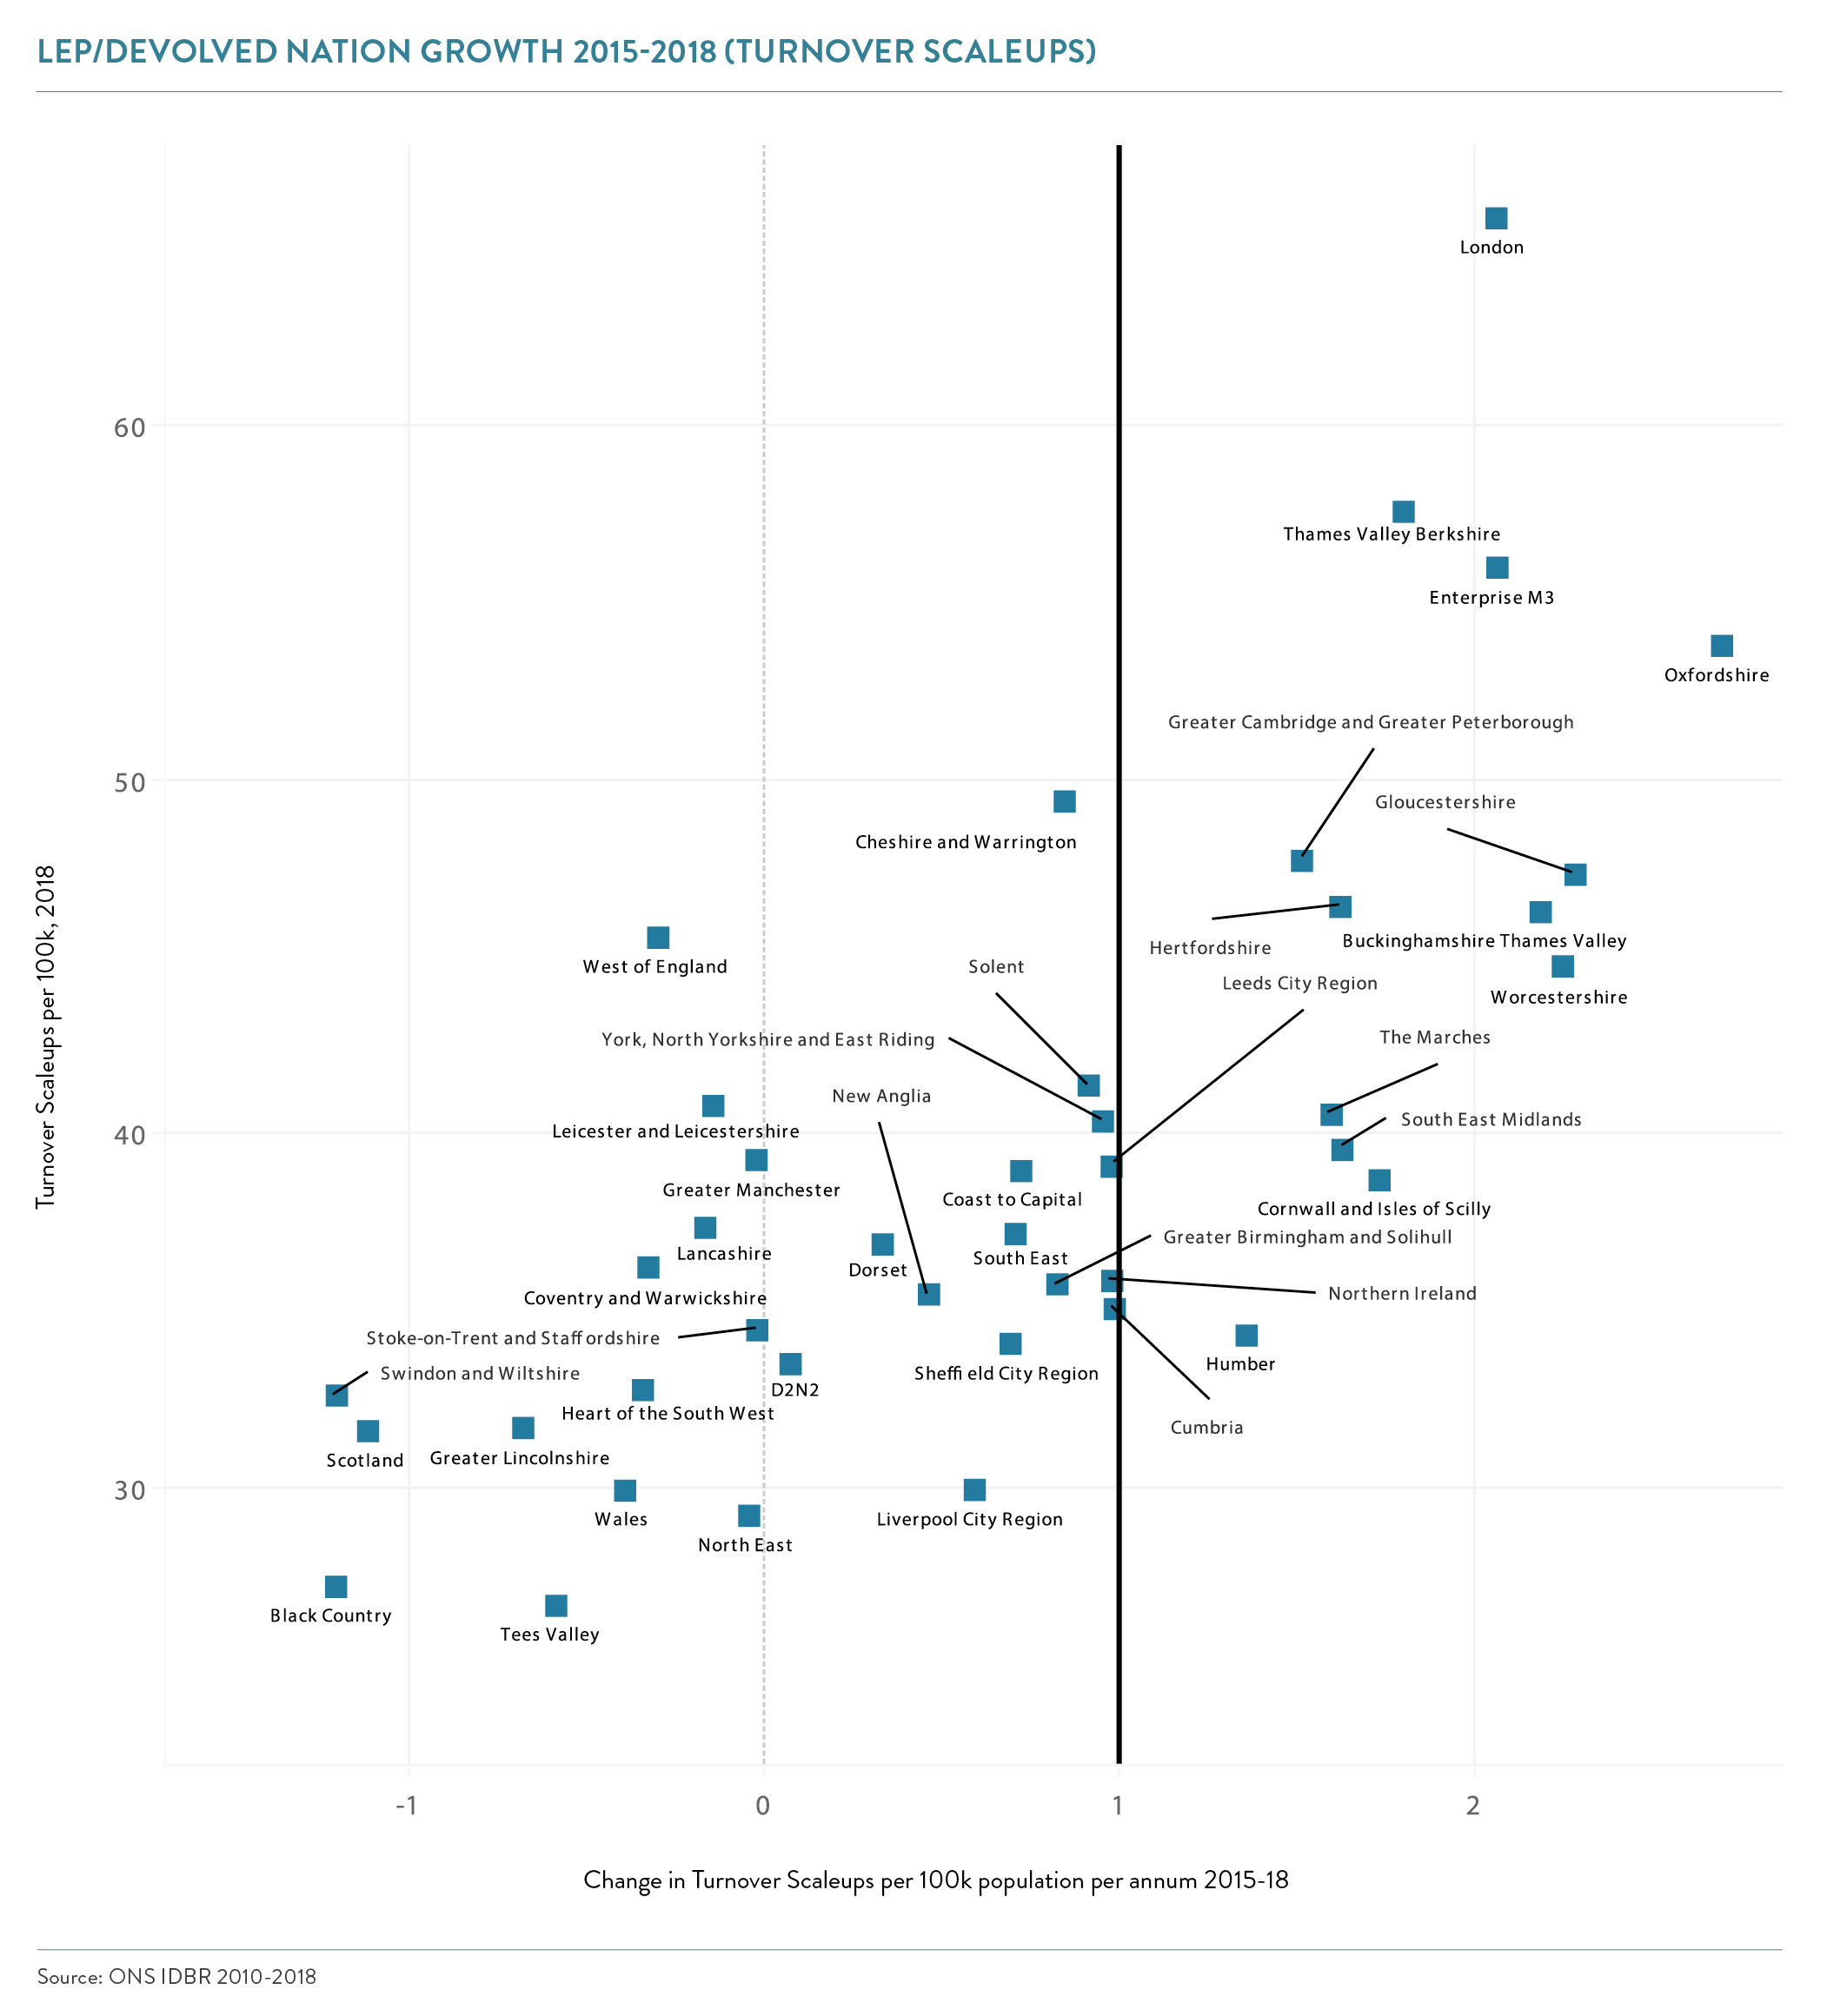
Local patterns on turnover and employment scaleups
The top 5 LEPs/devolved nations for growth in turnover scaleups were Oxfordshire, Gloucestershire, Worcestershire, Buckinghamshire Thames Valley, and Enterprise M3.
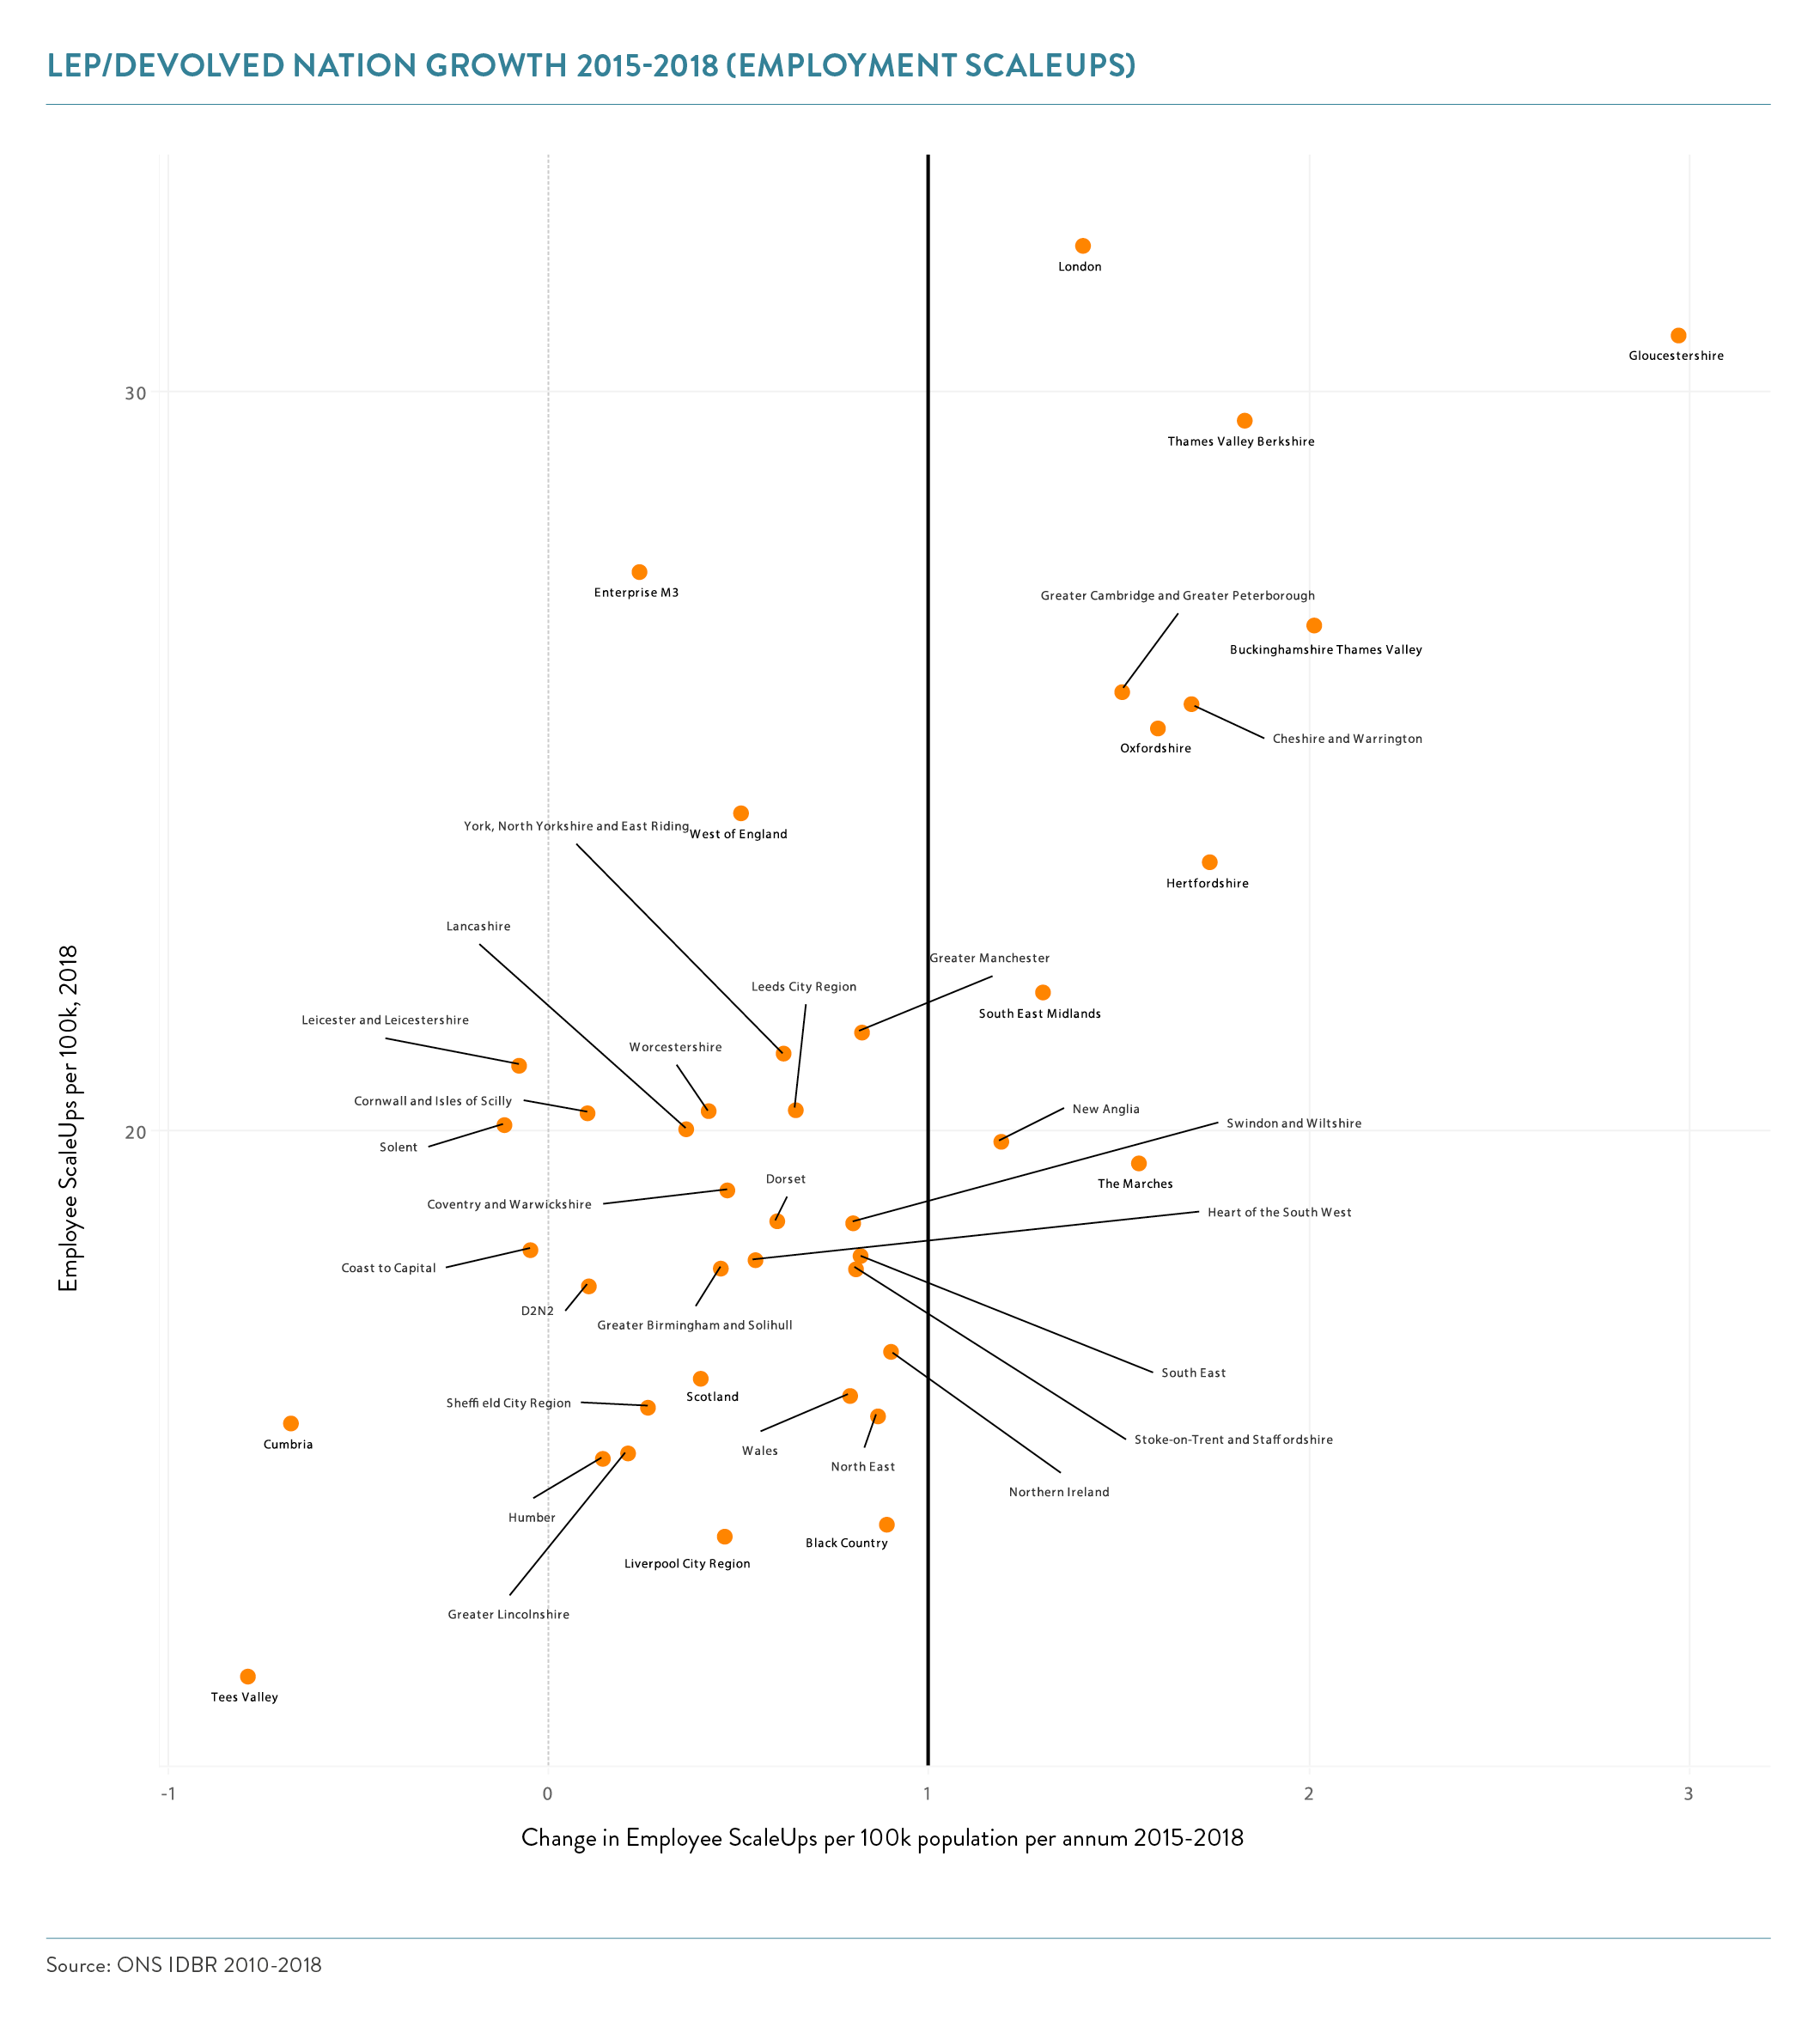
The top 5 LEPs/devolved nations for growth in employment scaleups were Gloucestershire, Buckinghamshire Thames Valley, Thames Valley Berkshire, Hertfordshire, and Cheshire and Warrington.
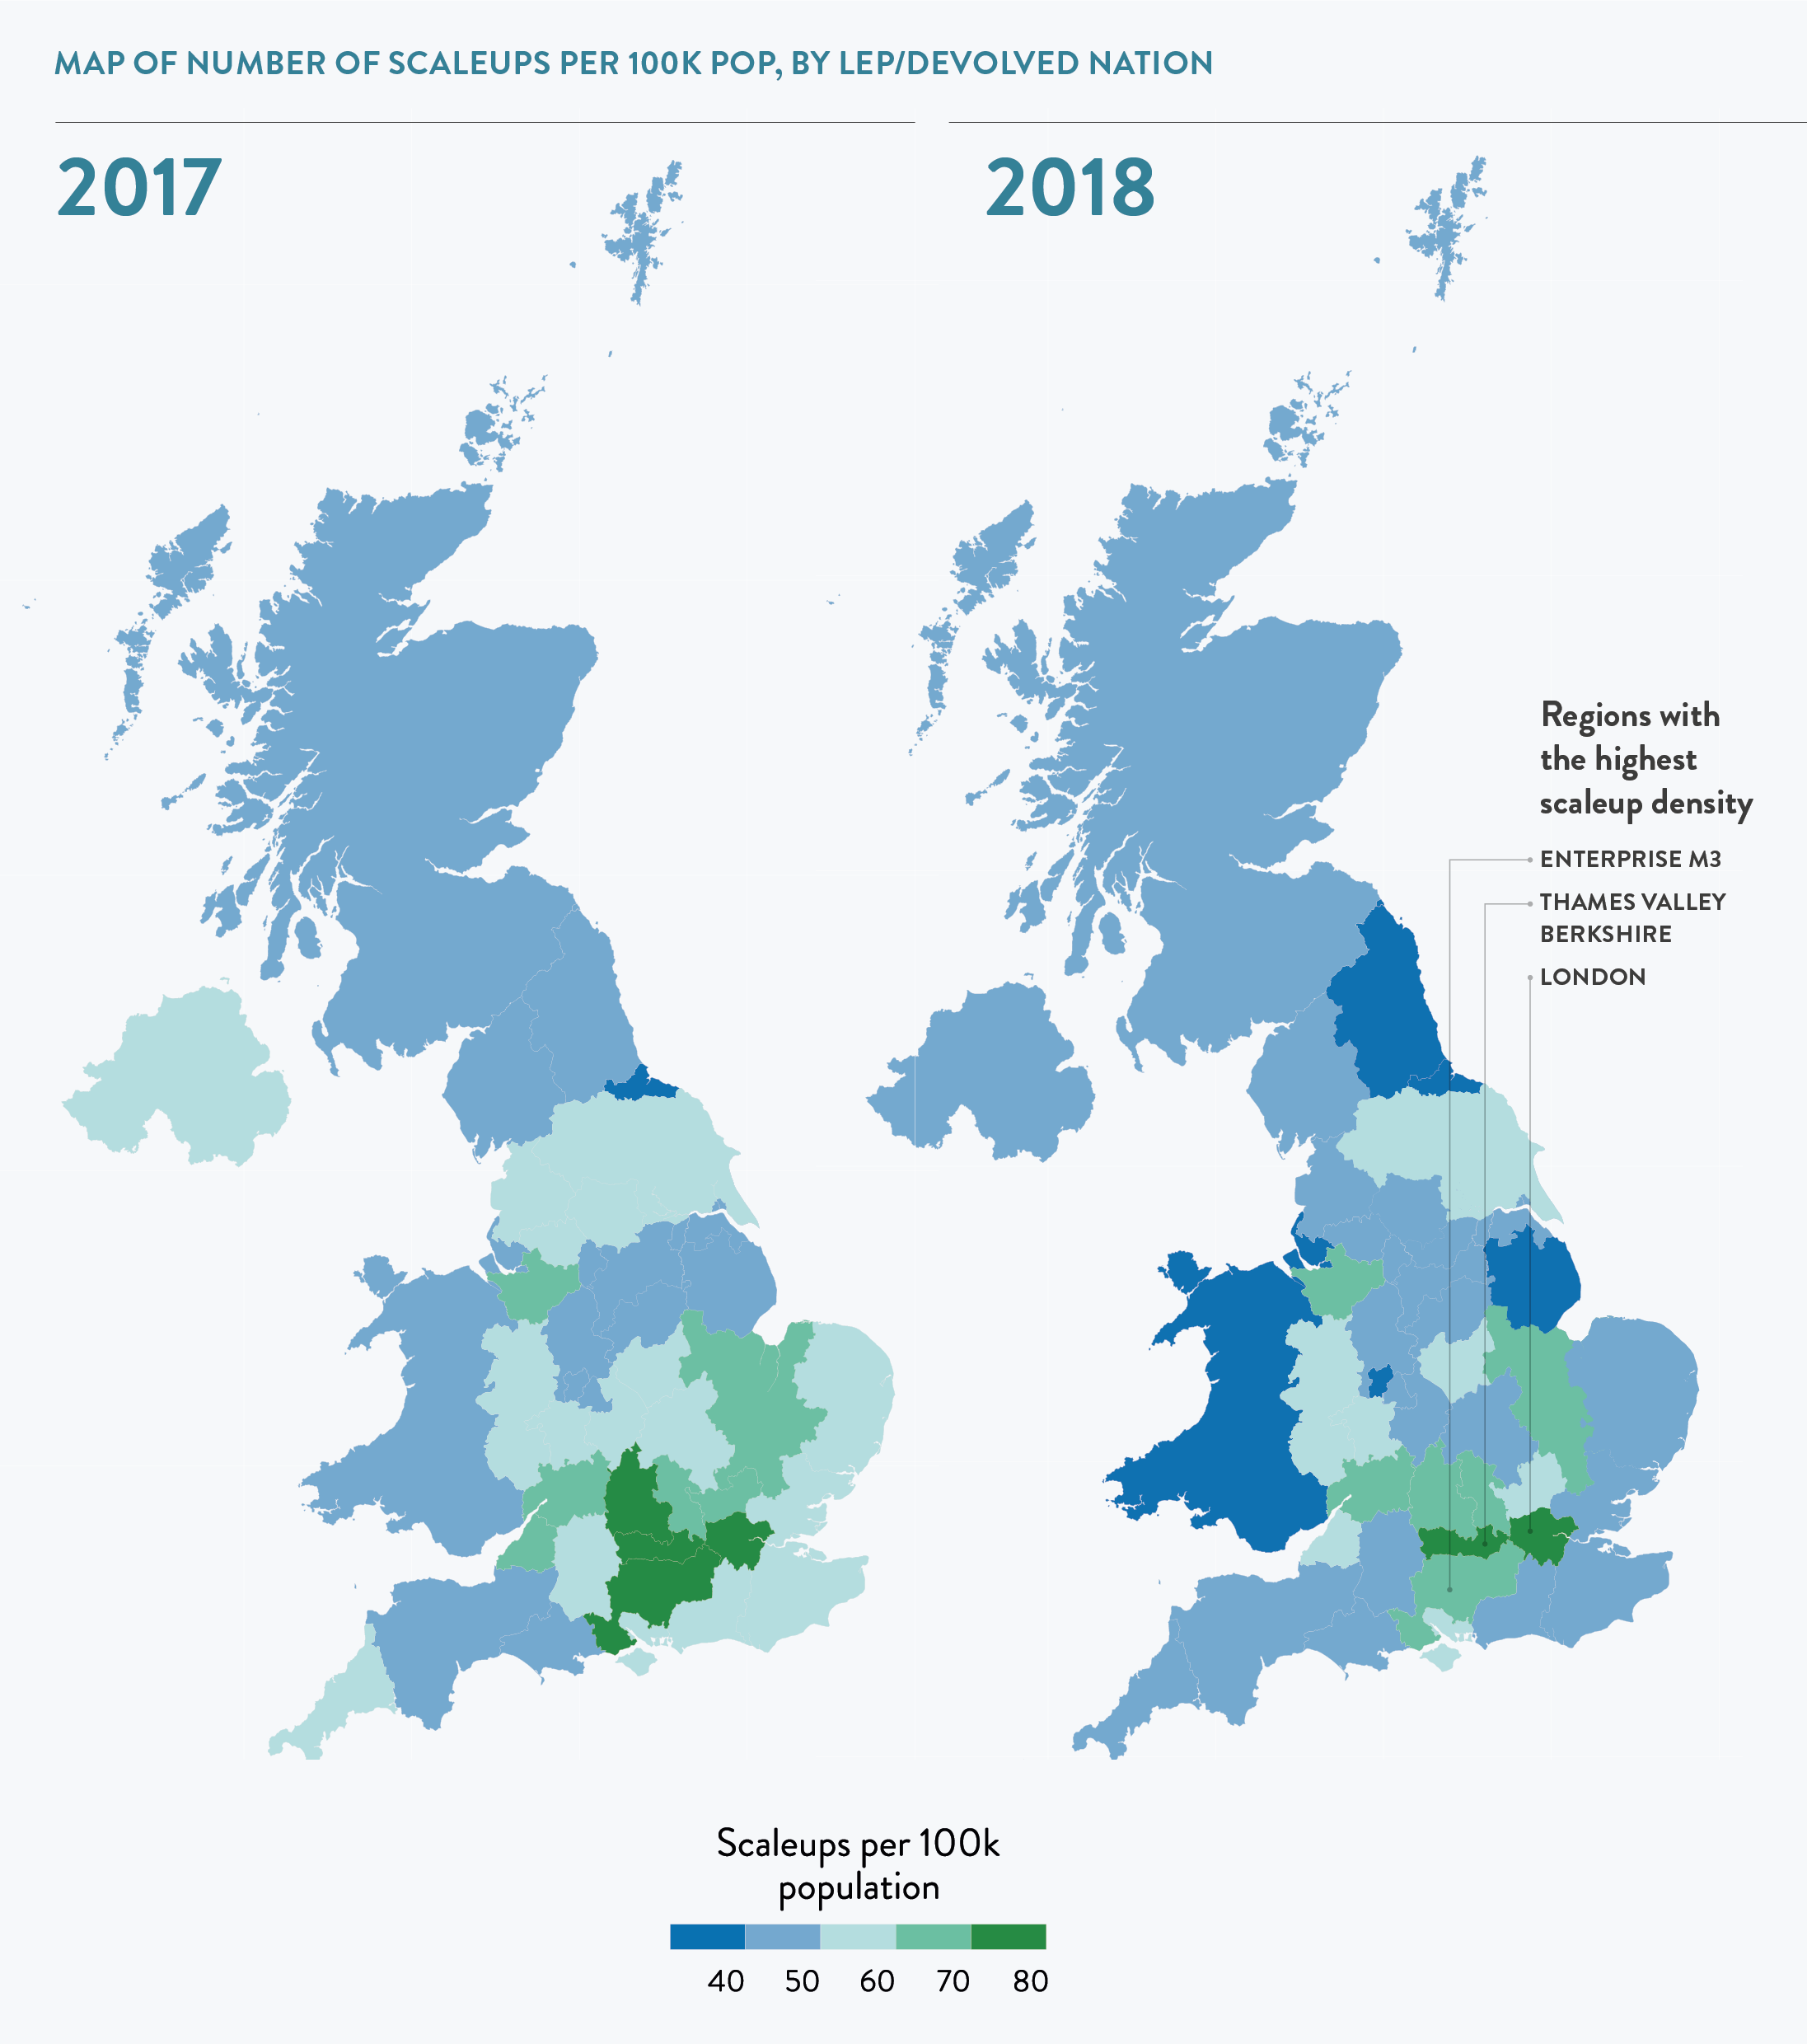
The growth in scaleups at a LEP level is also illustrated in the maps below, with areas of a more fertile green exhibiting higher growth and areas of blue showing slower growth or decline in scaleup populations. Relative to last year, there are more regions of slower growth, while the areas of highest growth are now Gloucestershire, Oxfordshire and Buckinghamshire Thames Valley.

The maps below show the variation in the absolute number of scaleups, adjusted for population.
LOCAL AUTHORITY PICTURE
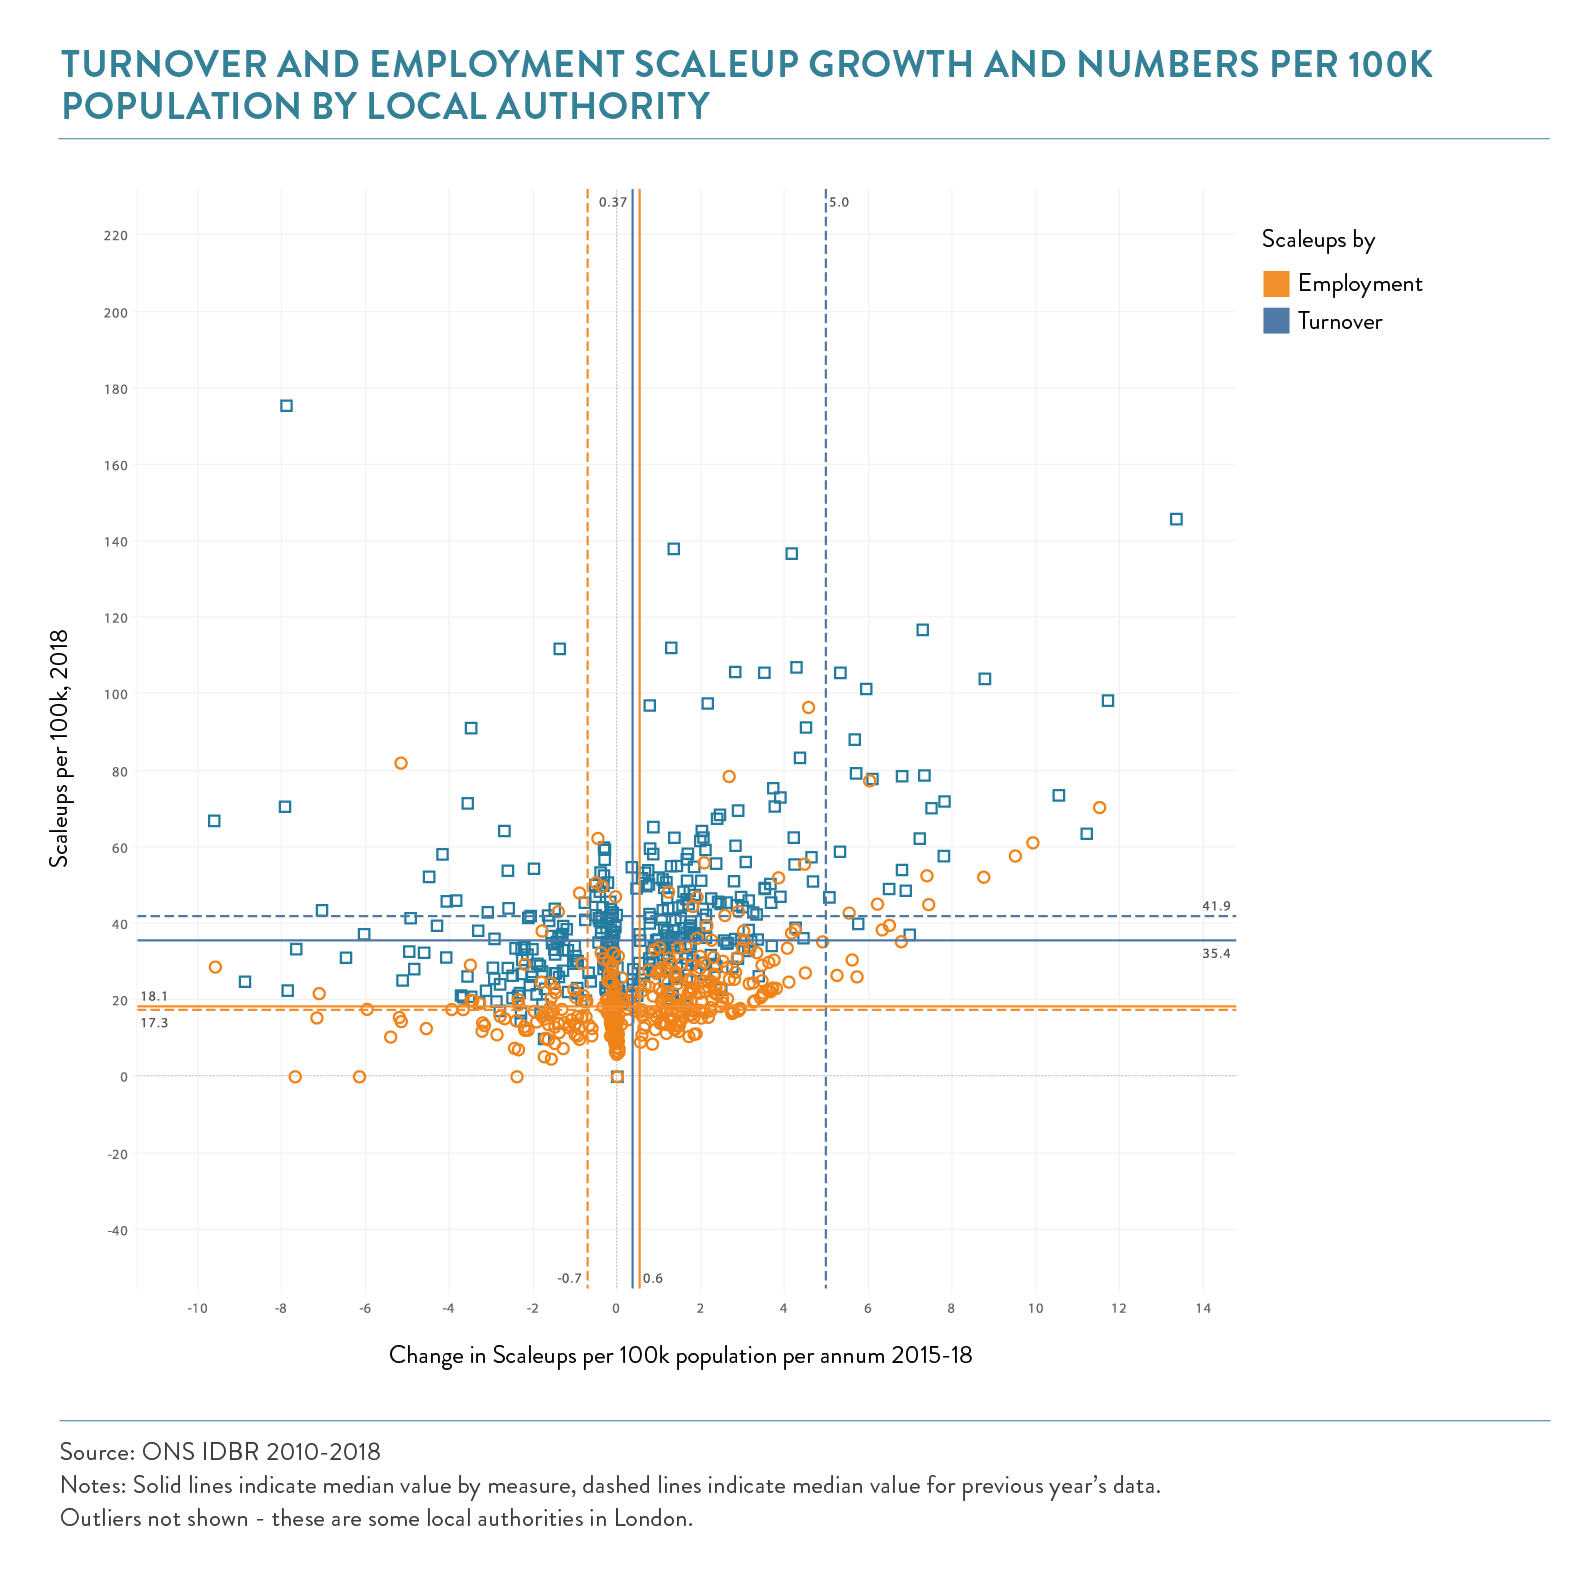
Analysis at specific local authority level highlights further regional disparities. The number of scaleups per 100,000 of population varied widely among local authorities – from less than 20 in Isles of Scilly, West Somerset, Lewisham, East Dunbartonshire and Inverclyde, to more than 100 in Surrey Heath and several London authorities. The figure below plots the number of employment and turnover scaleups by local authority against the growth rate.
The median growth rate and density for employment scaleups has increased, suggesting that scaleups across many local areas continued to hire in 2018. There were declines in the median density and growth rate for turnover scaleups, reflecting weaker turnover figures. Across the UK, all of 381 local authorities had more turnover scaleups than employment scaleups.
CONTENTS
Introduction 2020
Chapter 1 2020
The Scaleup business landscape
Chapter 2 2020
Leading Programmes Breaking Down the Barriers for Scaleups
Chapter 3 2020
The local scaleup ecosystem
Chapter 4 2020
Shaping policy to foster UK scaleups: Breaking down barriers
Chapter 5 2020
Looking Forward
Scaleup Stories 2020
Annexes 2020


Share