Explore the ScaleUp Annual Review 2020
Select a section to expand and explore this year's review..
CONTENTS
Introduction 2020
Chapter 1 2020
The Scaleup business landscape
Chapter 2 2020
Leading Programmes Breaking Down the Barriers for Scaleups
Chapter 3 2020
The local scaleup ecosystem
Chapter 4 2020
Shaping policy to foster UK scaleups: Breaking down barriers
Chapter 5 2020
Looking Forward
Scaleup Stories 2020
Annexes 2020
Small High Growth Businesses – the scaling pipeline
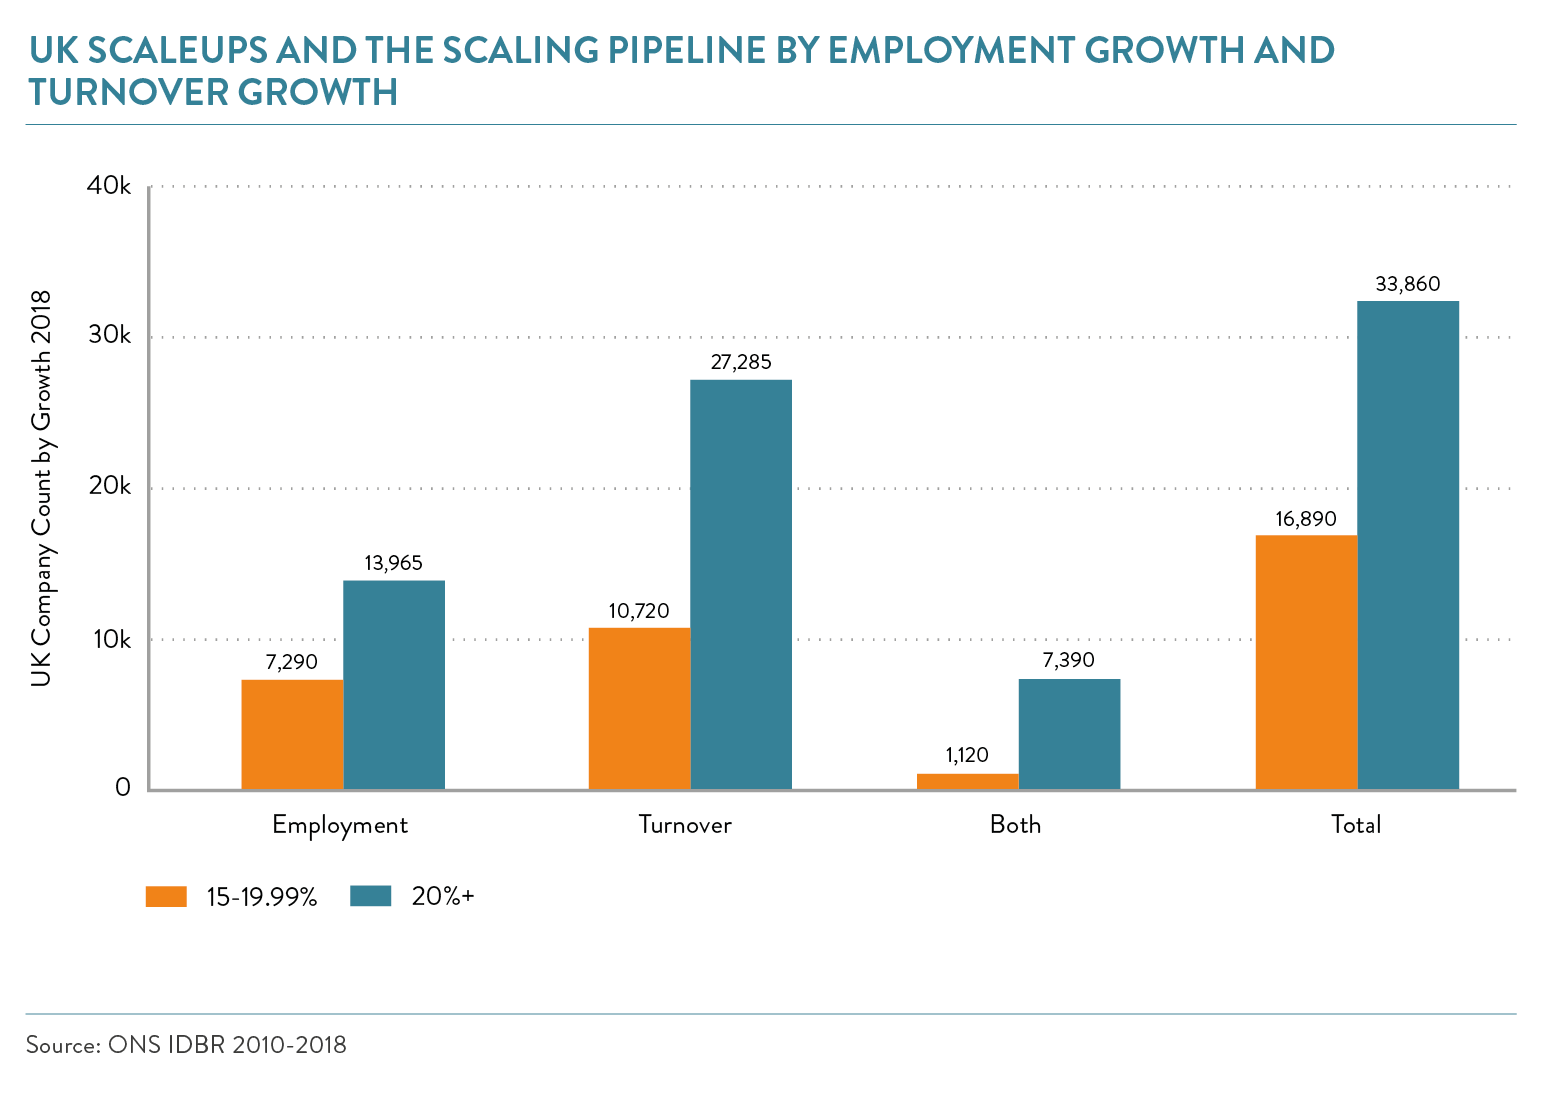
Leveraging new data is important to increase our understanding of the UK’s economy, as such in 2020, the Institute undertook analysis on those businesses that are not yet at scaleup growth rates but are growing either or both turnover and employment at rates just outside the 20% threshold at 15-19.99% annually. This substantial group constitutes part of our scaling pipeline.
In 2018 there were 16,890 scaling businesses, employing 1.9m people with a combined turnover of £592bn.
This new piece of research empowers us with better insights on the attributes of our pipeline and how this complements the scaleup ecosystem. A comparison of the absolute numbers of businesses in our scaling pipeline against scaleups reveals that although the number in the pipeline is half that of scaleups, proportionately, the pipeline appears to be strongest in companies measured by employment growth. Indicating that the scaleup pipeline may constitute an important source of future job creation.
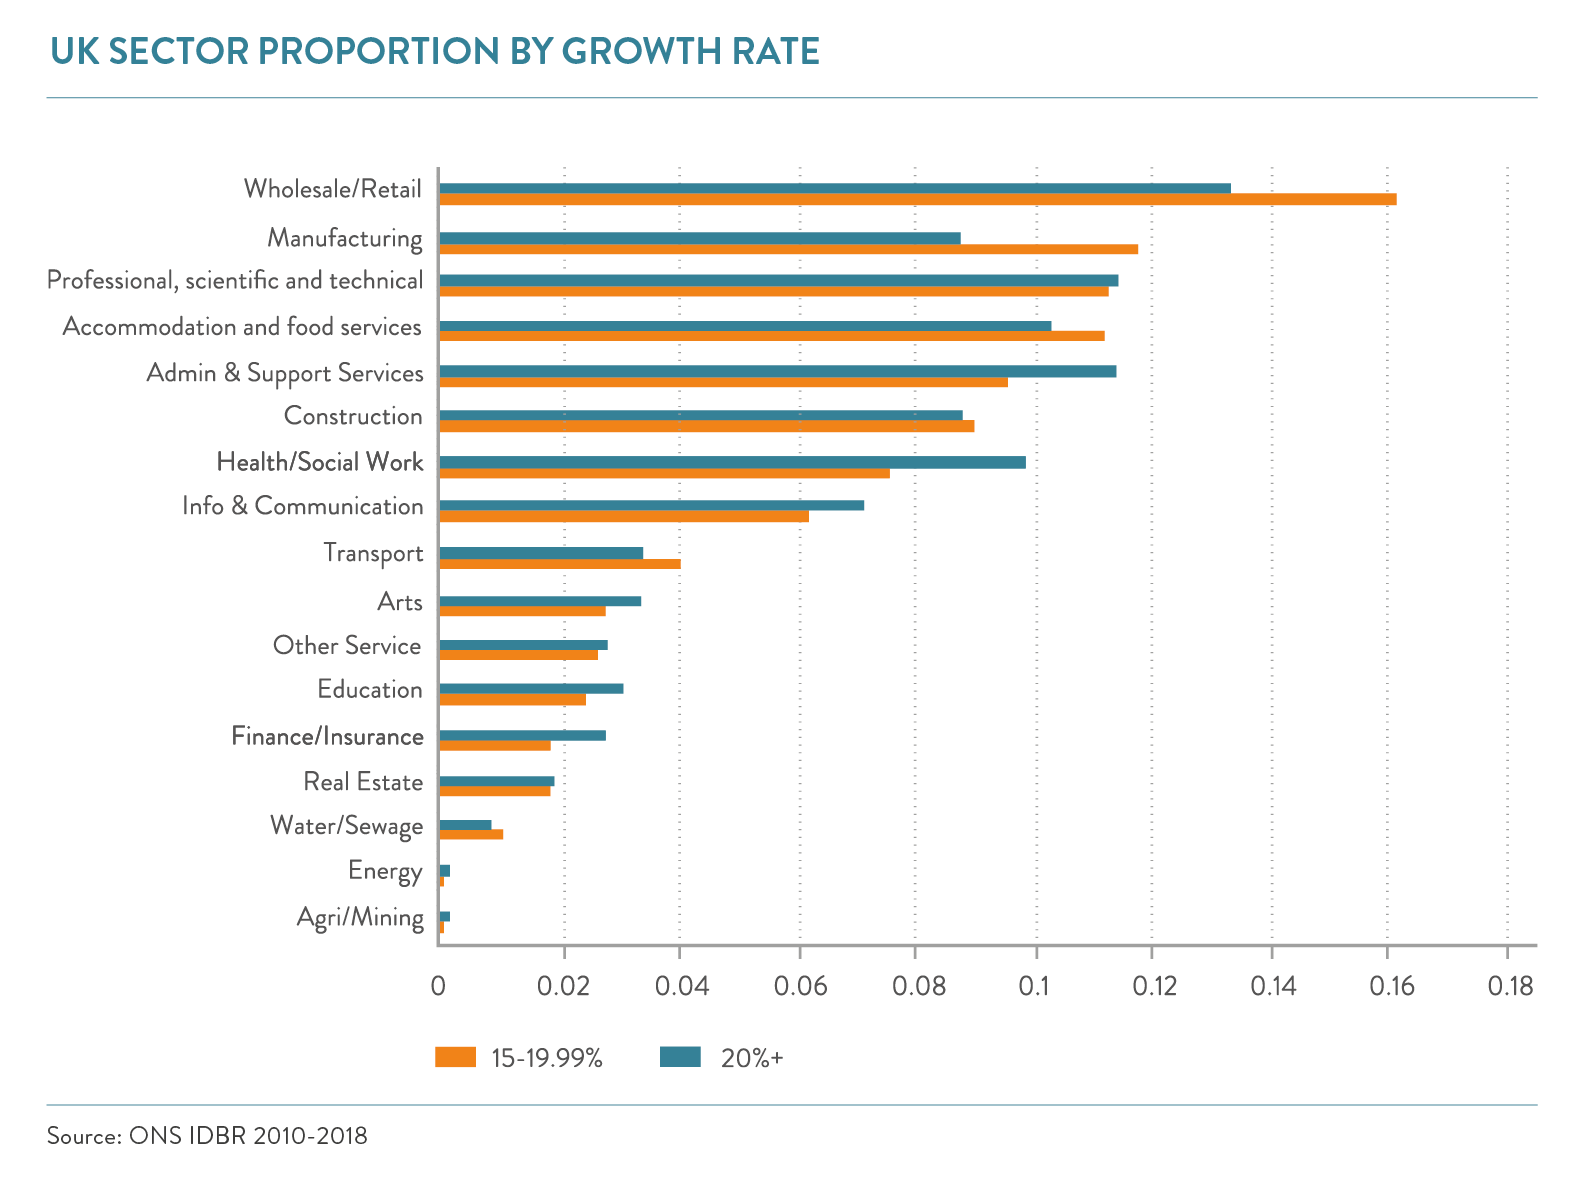
SCALING SECTORS
As with scaleups, businesses within the scaling pipeline in the UK are found across all sectors of the economy. The distribution is broadly comparable when viewed proportionally, however there are some notable differences:
- There are significantly more pipeline businesses operating in the manufacturing and wholesale/retail sectors than scaleups.
- But proportionately fewer pipeline businesses in health/social work, administration and support services, and finance/insurance.
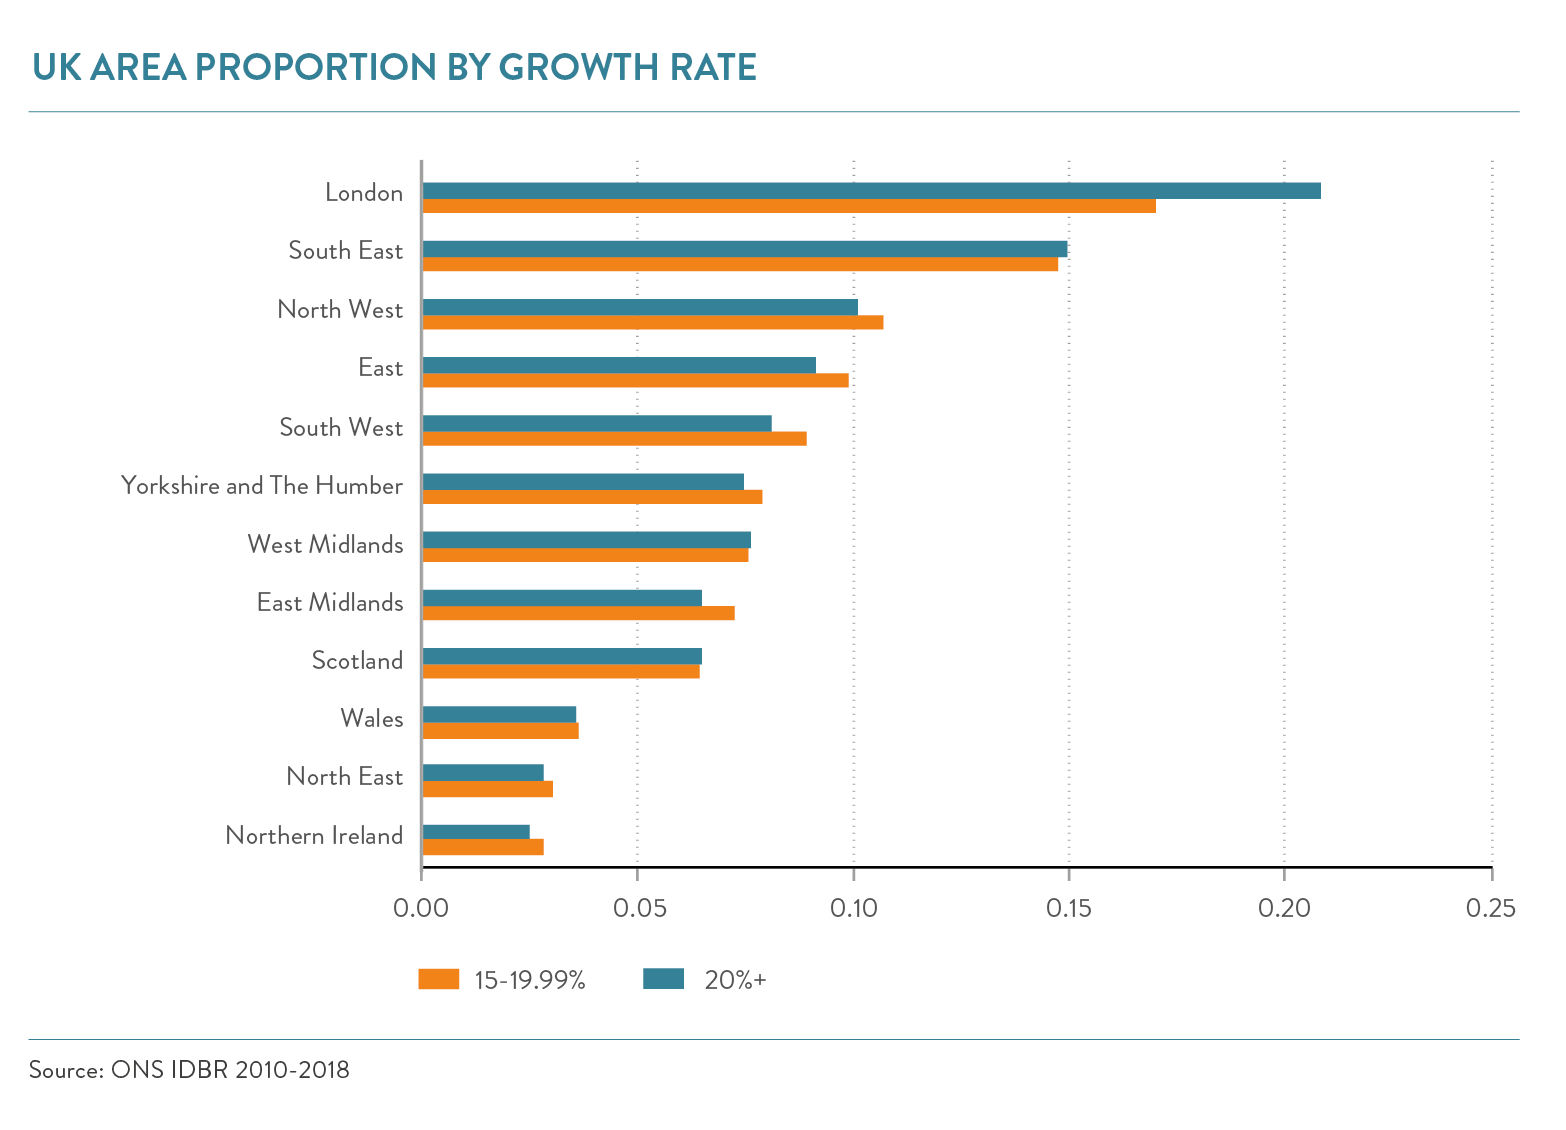
Regional distribution of the scaling pipeline
In most areas and regions, the spread of pipeline scaleups is consistent with the spread of scaleups. Only in London are there many more scaleups in comparison with the pipeline. In Northern Ireland, East Midlands, South West and East of England the pipeline of scaleups is greater relative to the number of scaleups.
When viewing the total numbers of scaling businesses and scaleups at the LEP and Devolved Nation level, we see similar trends between scaleups and those in the pipeline:
- London, Scotland, South East, Leeds City Region and Greater Manchester have the greatest numbers of scaling businesses. London, Scotland and the South East are also the three regions with the highest number of scaleups.
- The areas with the fewest businesses in their scaling pipeline were Tees Valley, Cumbria, Worcestershire and The Marches.
- The top and bottom ten areas in the number of pipeline scaleups were mirrored by the top ten and bottom ten areas for scaleups.
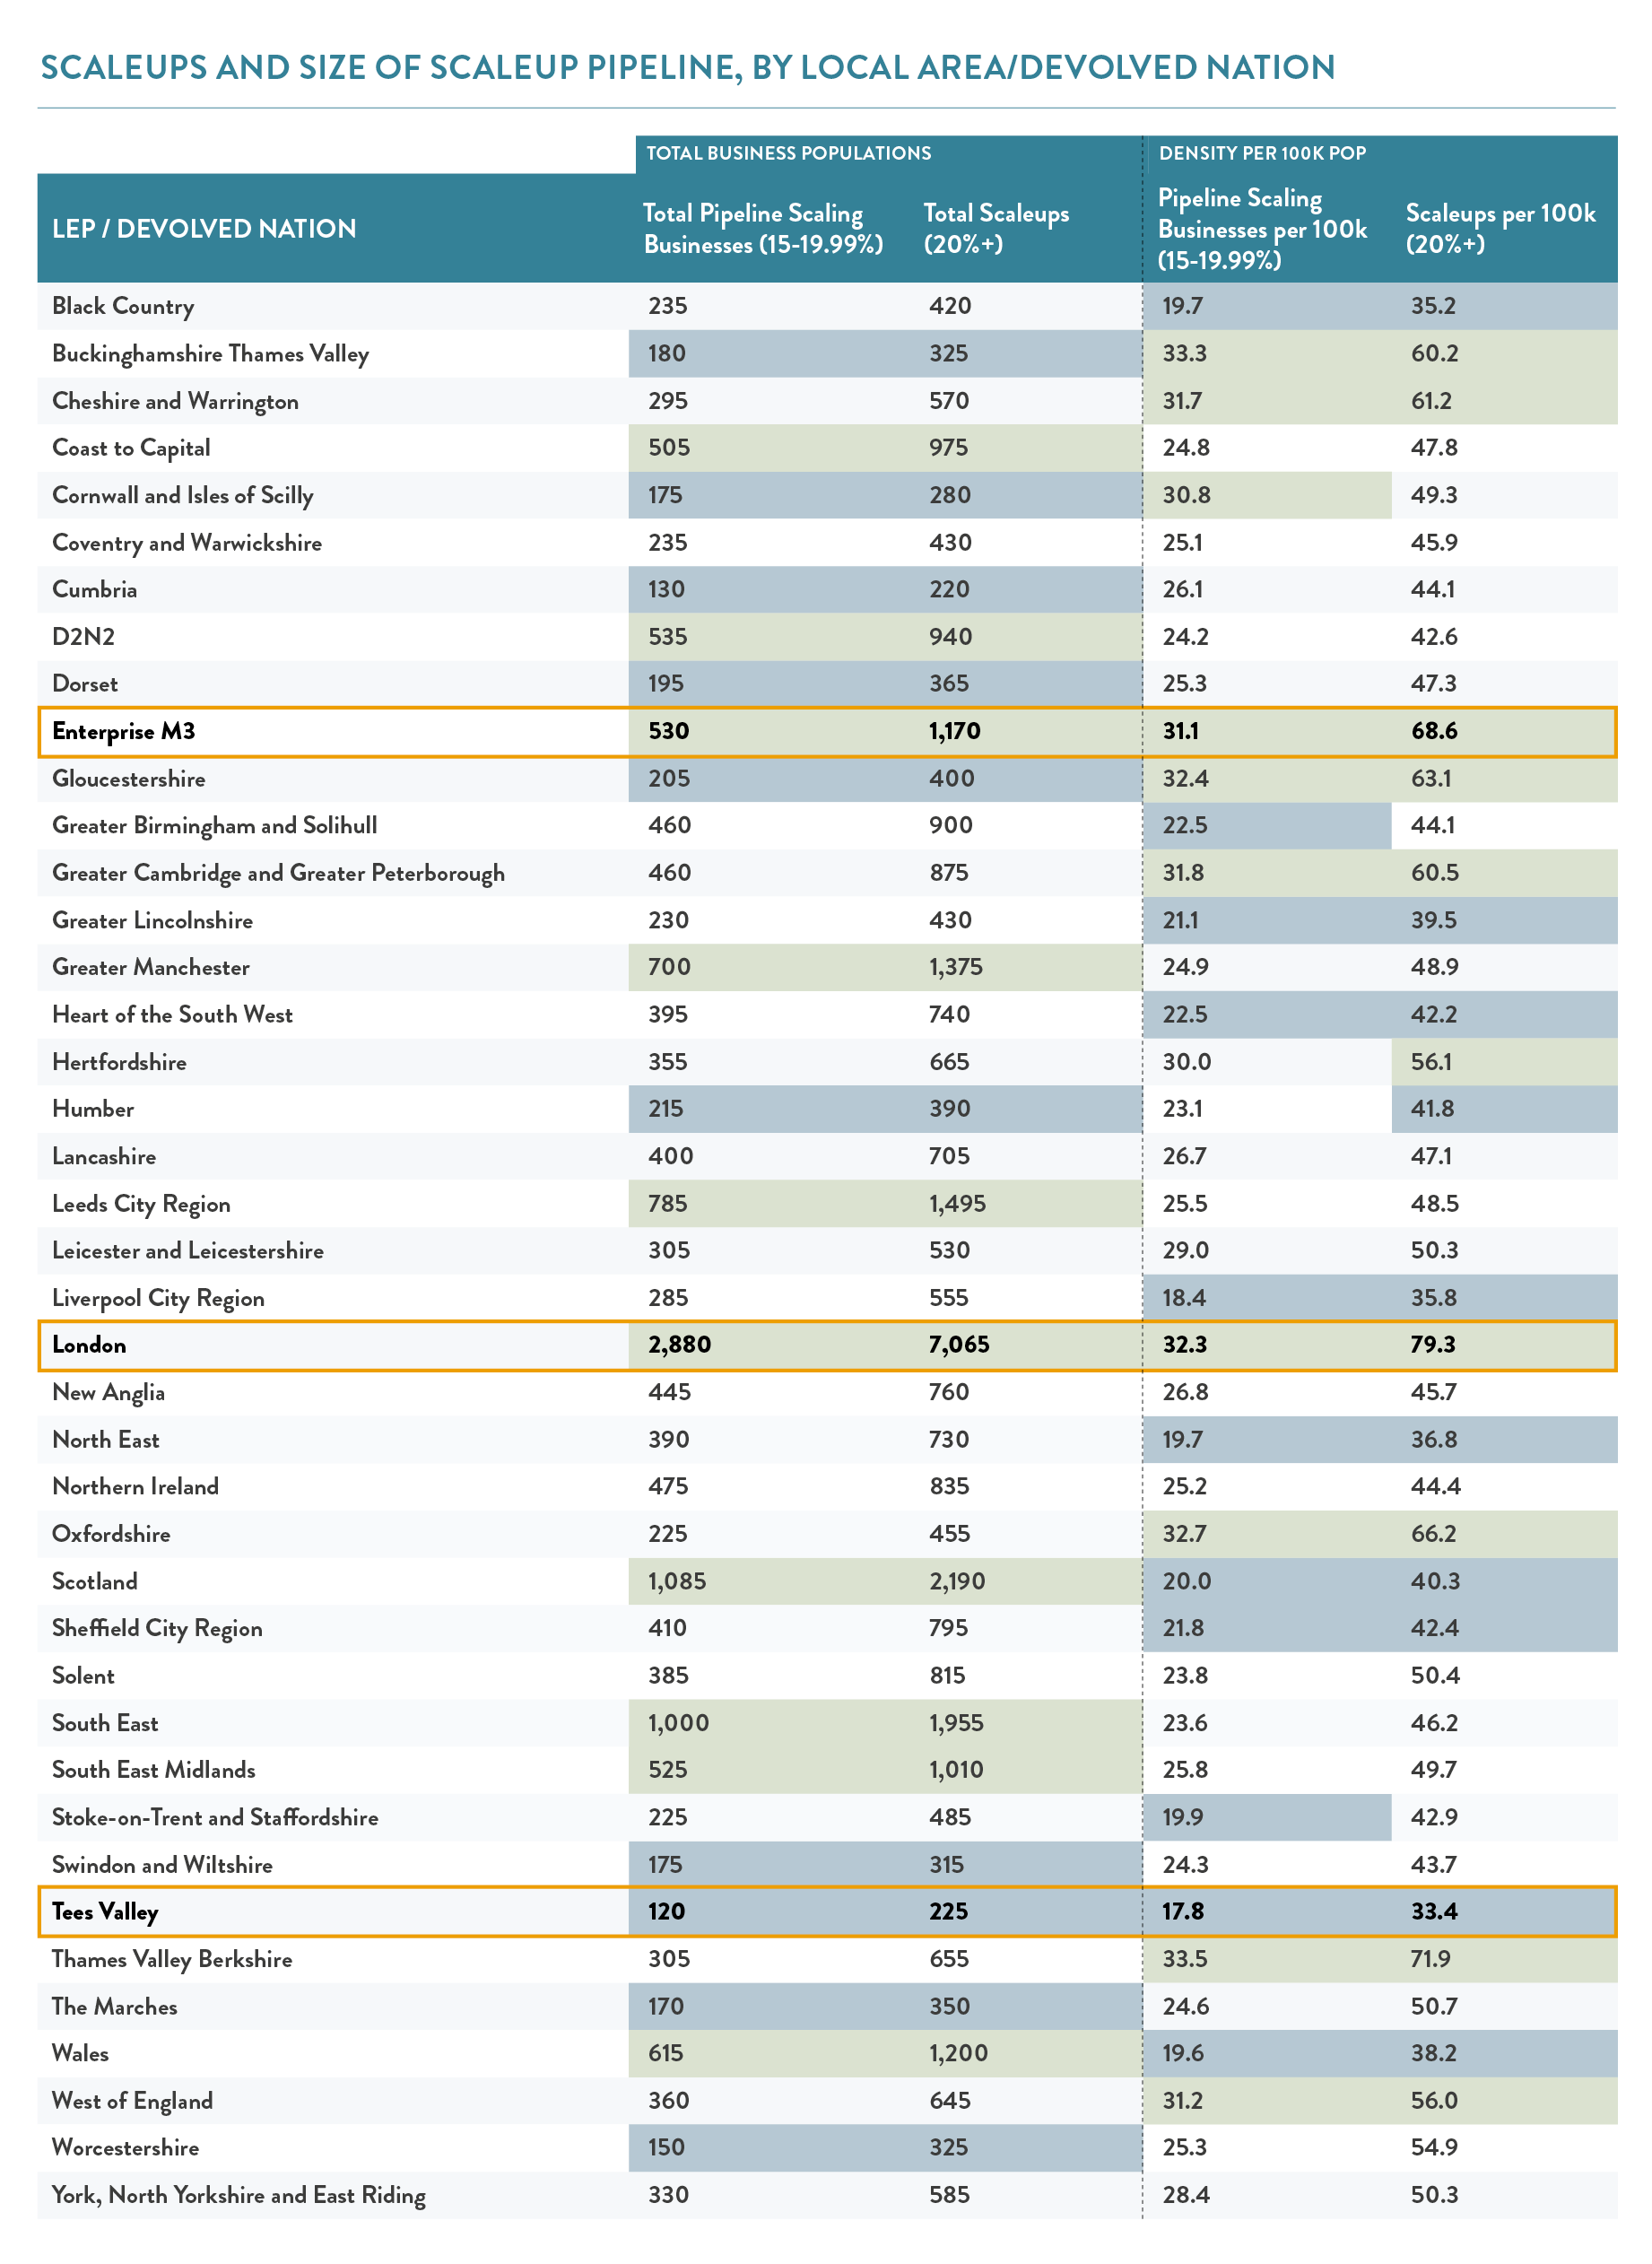
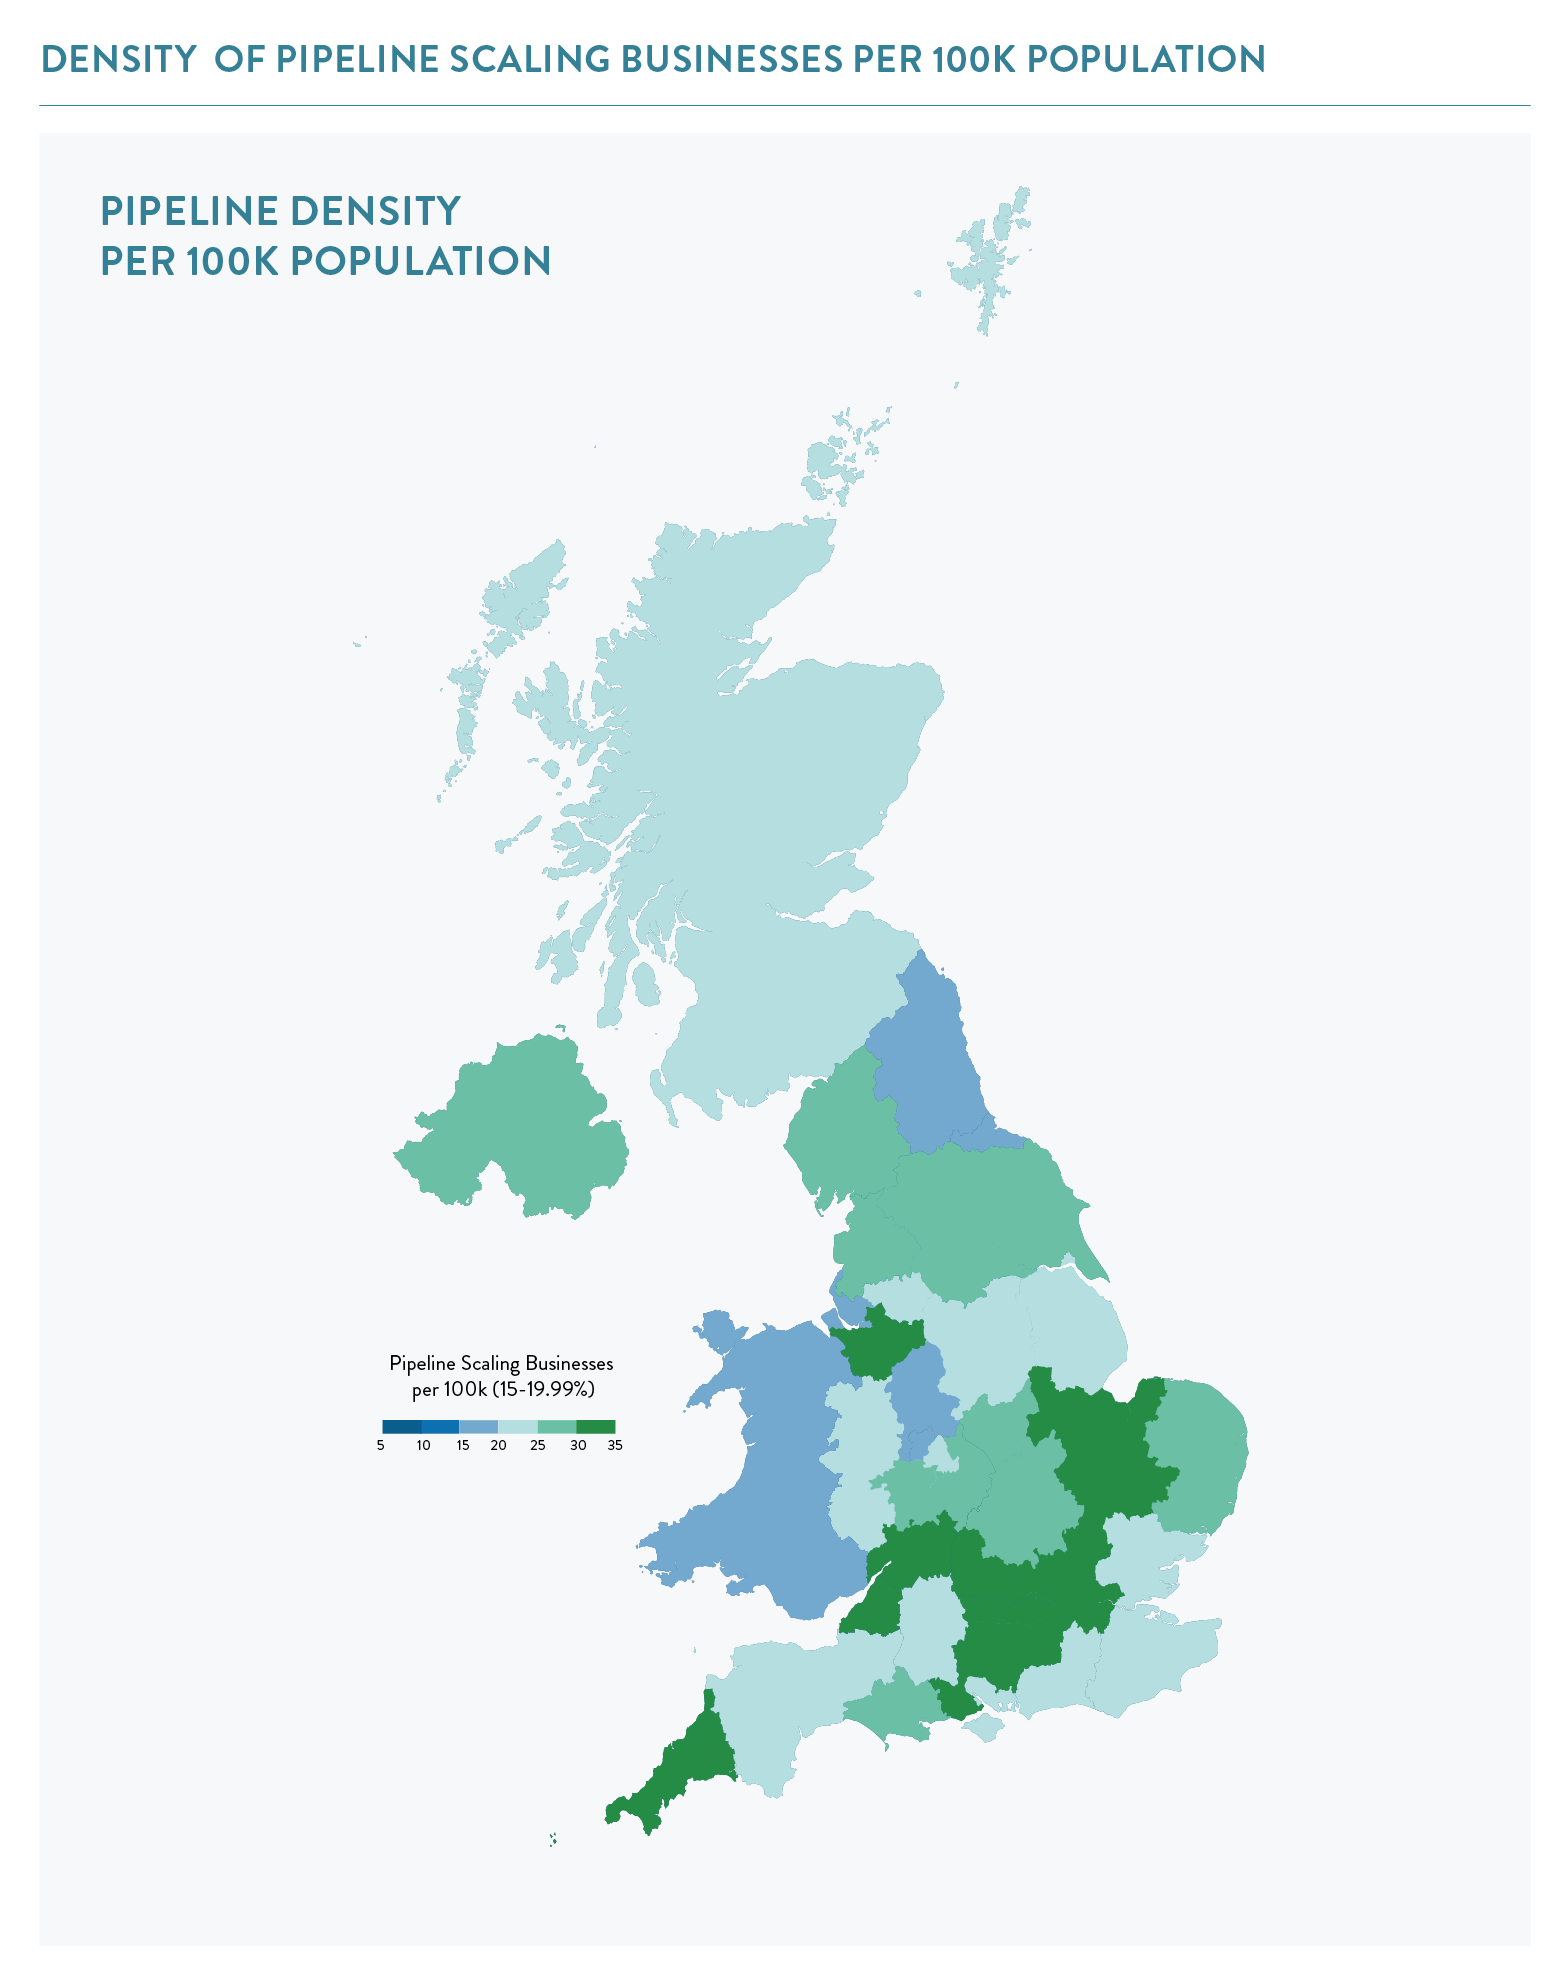
When viewing the density of scaling businesses per 100k population, the following trends are revealed:
- There is strikingly little difference between the places which have a strong scaling pipeline and high number of scaleups – nine of the top ten areas in pipeline scaling density were also in the top ten for scaleup density.
- Nine of the bottom ten areas in pipeline scaling density were also in the bottom ten for scaleup density.
Furthermore, there are significant differences when comparing the areas with the highest density and those with the greatest number of scaling businesses:
- 2 of the top 10 areas in scaling pipeline density were also in the top 10 for absolute number of pipeline scaling businesses – London and Enterprise M3 (outlined in orange on the table above).
- Tees Valley was the only area in the bottom 10 in scaling pipeline density and also in the bottom 10 in terms of total pipeline scaling businesses.
CONTENTS
Introduction 2020
Chapter 1 2020
The Scaleup business landscape
Chapter 2 2020
Leading Programmes Breaking Down the Barriers for Scaleups
Chapter 3 2020
The local scaleup ecosystem
Chapter 4 2020
Shaping policy to foster UK scaleups: Breaking down barriers
Chapter 5 2020
Looking Forward
Scaleup Stories 2020
Annexes 2020


Share