Explore the ScaleUp Annual Review 2020
Select a section to expand and explore this year's review..
CONTENTS
Introduction 2020
Chapter 1 2020
The Scaleup business landscape
Chapter 2 2020
Leading Programmes Breaking Down the Barriers for Scaleups
Chapter 3 2020
The local scaleup ecosystem
Chapter 4 2020
Shaping policy to foster UK scaleups: Breaking down barriers
Chapter 5 2020
Looking Forward
Scaleup Stories 2020
Annexes 2020
Drivers of scaleup growth
Since 2014, the ScaleUp Institute has consistently identified access to skills, markets, local leadership, finance and infrastructure as the key barriers to scaleup growth3. This has been reinforced by a growing body of literature on scaleups.4,5 There are many potential drivers of growth; however, there is currently insufficient research available assessing the regional economic drivers of scaleup growth. In a report for the OECD, Audretsch and David said that “the geographical dimension [of high-growth firms] have been largely overlooked.”6
To better understand the factors that drive scaleup growth, in collaboration with Arup, we interviewed a sample of scaleup leaders across the UK, carried out a detailed review of recent academic literature and conducted an in-depth statistical analysis of growth factors.
We sought to answer the following question:
“What, if any, place-based drivers of scaleup growth can be identified in the UK?”
We gathered both qualitative and quantitative evidence. This mixed methods approach allowed us to dig deeper into local drivers of growth than before.
Qualitative Analysis
In collaboration with Arup, we conducted semi-structured in-depth interviews across a range of local areas from high performing to developing growth paths (Oxford, West of England; Thames Valley Berkshire; North East, Leeds City Region, Scotland, Cornwall & the Isles of Scilly, Greater Manchester). Local leaders consistently identified these areas as key drivers of scaleup growth:
- Knowledge sharing – where individuals, businesses and institutions build informal networks which enable knowledge, skills and experience to be spread more widely.
- Active network of peers.
- Strong local supply chains with links between small and large firms
- Access to qualified non-executive board members
- Active University Engagement
- Providing relevant training
- Research collaboration
- Interaction between scaleups and graduates
- Local Ambitions
- A strong sense of local identity and ambition
- Support and goodwill from the wider group of local stakeholders
Quantitative Analysis
Informed by this evidence and insight, we identified a number of potential factors linked to scaleup growth, as measured by the average increase in scaleup density between 2013-2018. We used data from the Census, ONS and Beauhurst, at a local authority district (LAD) level. Regression analysis allowed us to isolate the effects of specific factors. We used spatially lagged variables to control for spillover effects from neighbouring areas. We also controlled for GVA and GVA growth.
From this analysis, we found three main factors driving scaleup growth – equity finance, skills and sectoral clustering. A number of other factors saw no clear relationship with scaleup growth – SME lending rates, proportion of large firms, start-up density and start-up survival rate. We used spatially lagged variables for each factor which account for the effects from neighbouring areas. We also accounted for the starting GVA of the area and GVA growth. The effects remained robust even after controlling for these factors.
FACTORS AND THEIR ROLE IN SCALEUP DENSITY GROWTH 2013-2018
| Factor | Description | Relationship with scaleup density growth 2013-2018 |
| Skills | Proportion of 16-24 year olds with Level 4+ qualifications. This comes from the most recent Census data (2011) and provides an appropriate lag between the time that young people acquire skills and when they enter the workforce. | Positive |
| Sectoral Clustering | Proportion of companies from the most concentrated sector in a given LAD, obtained using ONS IDBR data. | Positive up to a saturation level |
| Equity | Visible SME equity funding per 100k population in 2013-2014, providing an appropriate period of time for funded SMEs to become scaleups. This data was obtained from Beauhurst’s high growth company database. | Positive |
| Lending | SME bank lending per 100k population in 2013-2014, providing an appropriate period of time for funded SMEs to become scaleups. This was obtained using UK Finance data. | No clear relationship |
| Large Firms | Proportion of firms with 250+ employees in a given LAD. This was obtained using ONS IDBR data. | No clear relationship |
| Start-up density | Start-ups per 100k population in 2012. This time lag is necessary to give start-ups a suitable amount of time to become scaleups. This was obtained using ONS IDBR data. | No clear relationship |
| Start-up survival rate | Proportion of start-ups from 2012 surviving after 5 years. This was obtained using ONS IDBR data. | No clear relationship |
| Public Transport | Time to get to key services using public transport (England only data), obtained using Gov.uk data. | No clear relationship |
High skills are associated with faster scaleup growth
We assessed skills by looking at the proportion of 16 to 24 year olds in a given area with Level 4+ qualifications, indicating post-secondary education or training.7 Higher skills are associated with an increase in scaleup growth, even after controlling for other factors. High population density on its own did not produce high levels of scaleup growth, unless it was accompanied by high levels of skills.
Local leaders should focus on building skills in their area. Businesses should focus on finding skilled individuals who can transfer ideas and generate innovation.
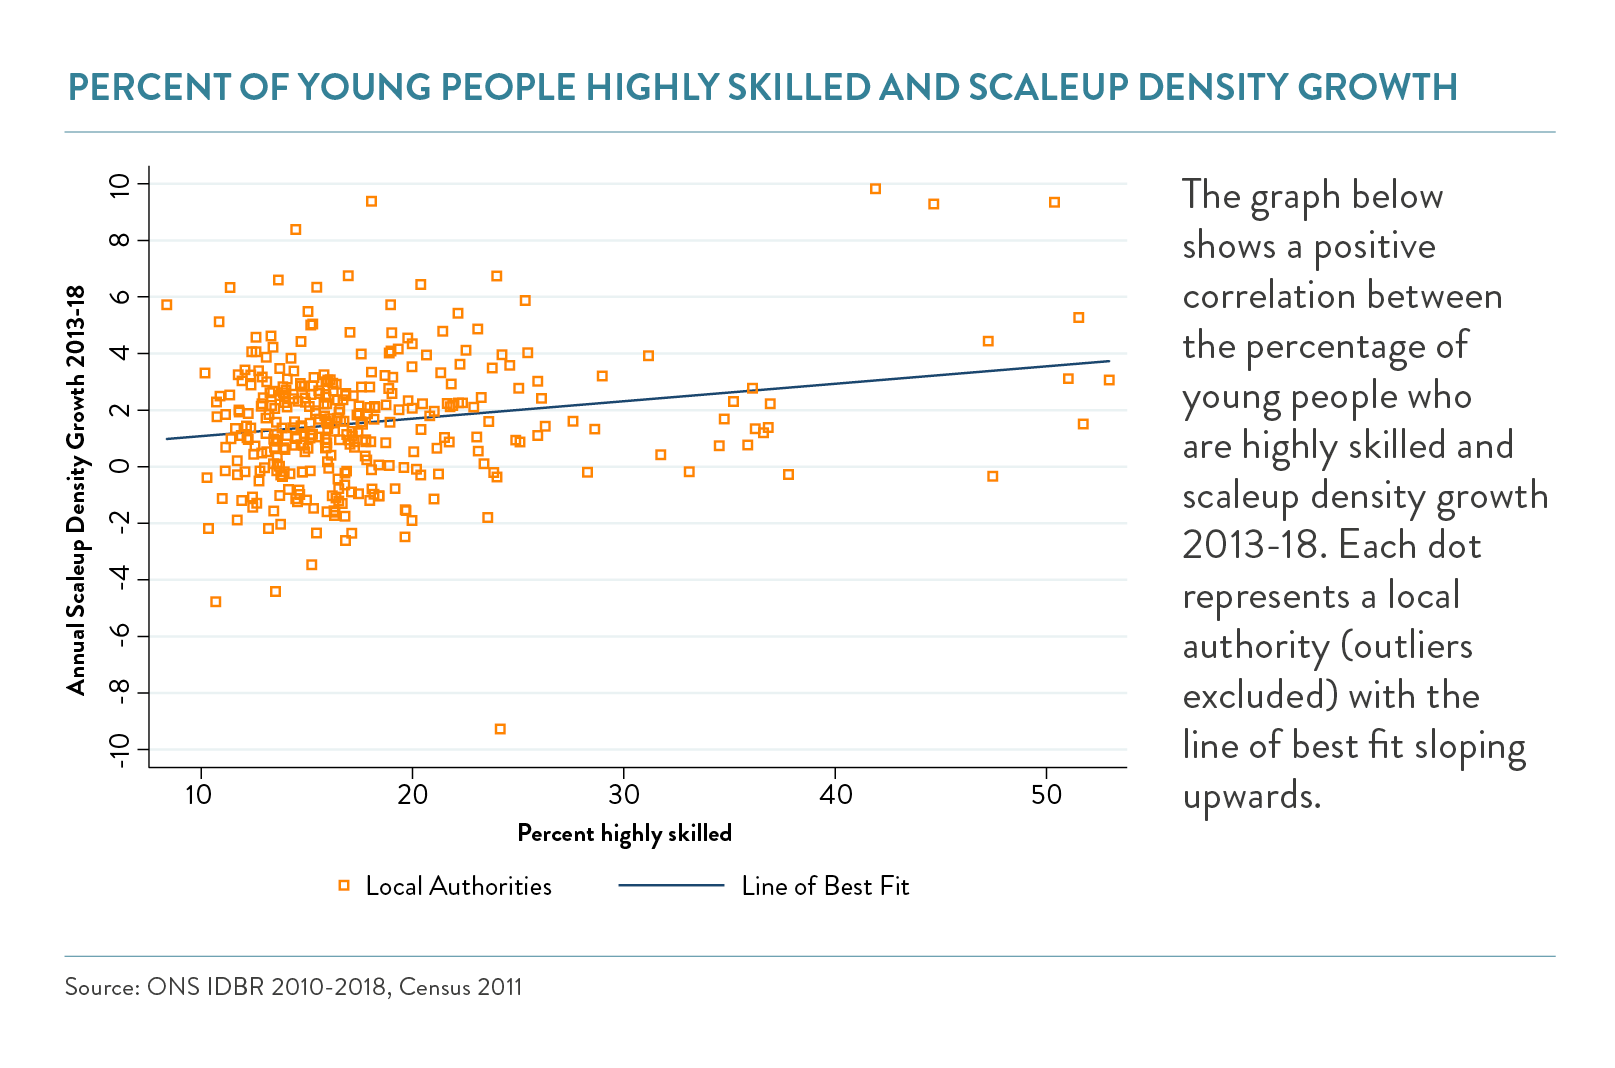
The graph above shows a positive correlation between the percentage of young people who are highly skilled and scaleup density growth 2013-18. Each dot represents a local authority (outliers excluded) with the line of best fit sloping upwards.
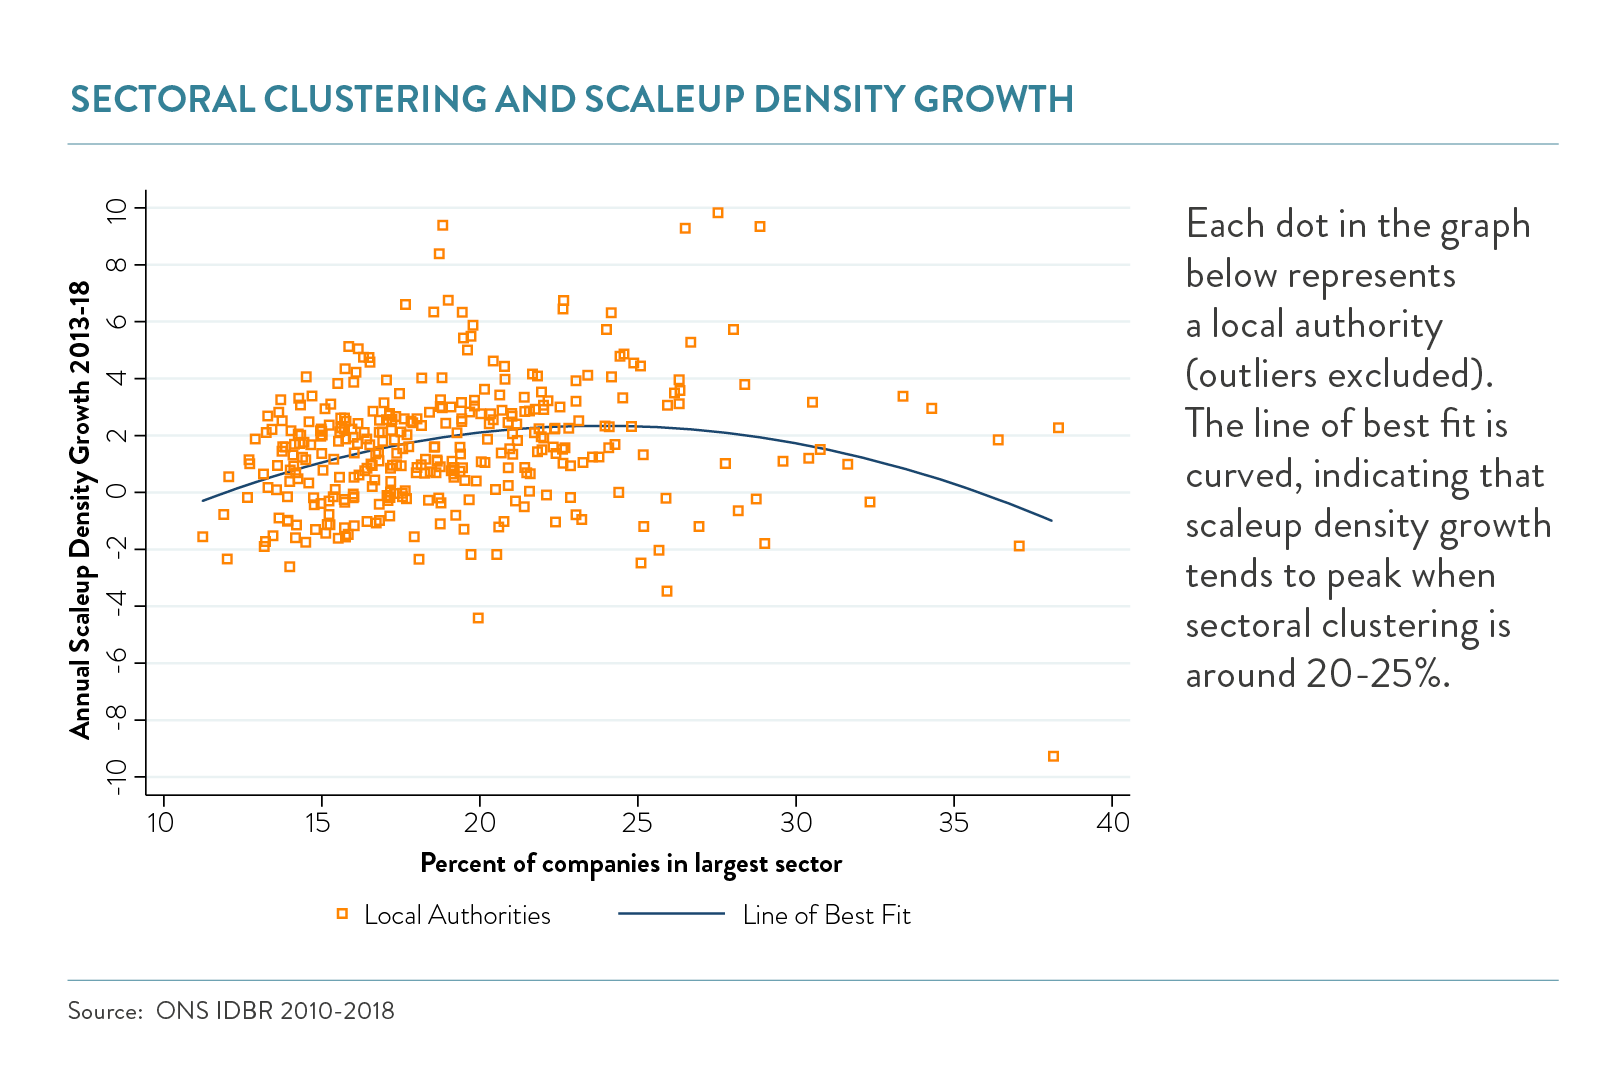
Sectoral clustering and hubs are associated with faster scaleup growth
Evidence from the academic literature suggests that clustering allows firms to share resources and transfer knowledge.8,9
Using ONS data, we examined sectoral clustering by looking at the proportion of firms accounted for in the largest industry in a given local area.10 Having a good cluster and proportion of businesses from a given industry does support increased scaleup growth.
However, the analysis also shows if it becomes over concentrated in any one industry, then the growth effects are diminished as areas become reliant on that industry. Local areas should exploit their sector strengths, but make sure that diversity of sectors remains.
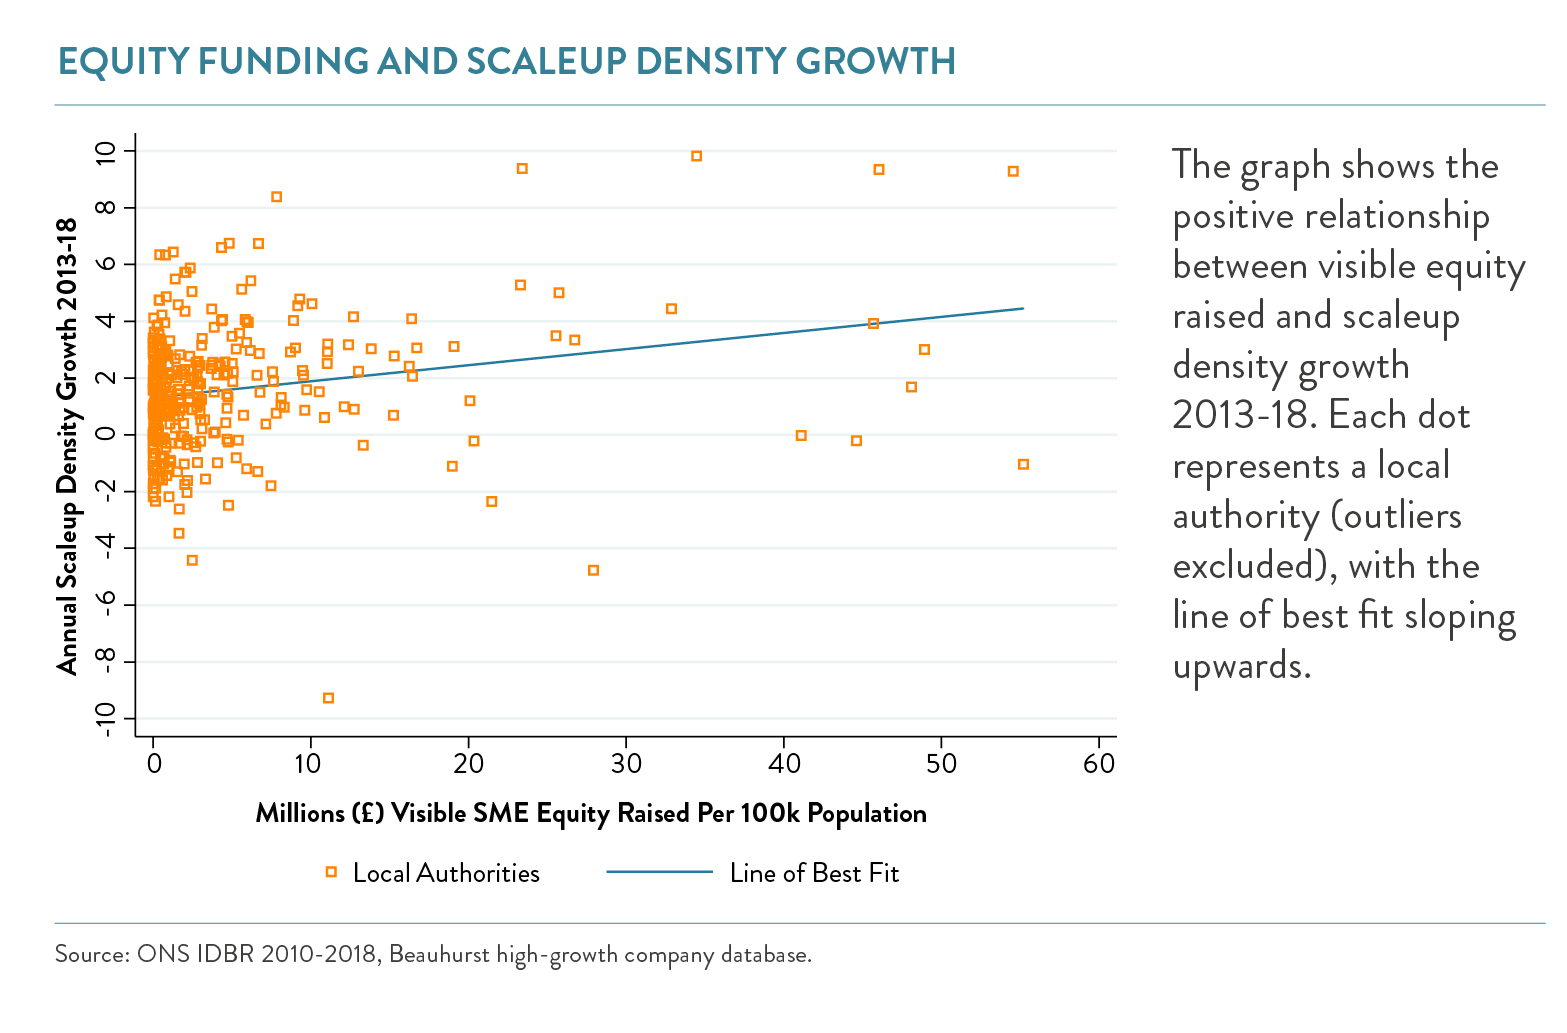
Equity funding is a driver of scaleup growth, while debt is not
In assessing the effect of equity financing on scaleups, we looked at the amount raised by SMEs through equity investments per 100,000 people in Visible Scaleups using the Beauhurst database.11 These are companies which meet the 20%+ growth threshold and file full accounts at Companies House. Areas with access to larger amounts of equity finance tend to have faster growth in the number of scaleups, even after controlling for other variables. Higher levels of lending, in contrast, showing no clear relationship with scaleup growth.
This highlights the importance of equity for building scaling businesses. There is a gap in the ability of companies outside of London and the South East in getting access to equity finance. Closing this will be vital to increasing scaleup growth across the country.
CONTENTS
Introduction 2020
Chapter 1 2020
The Scaleup business landscape
Chapter 2 2020
Leading Programmes Breaking Down the Barriers for Scaleups
Chapter 3 2020
The local scaleup ecosystem
Chapter 4 2020
Shaping policy to foster UK scaleups: Breaking down barriers
Chapter 5 2020
Looking Forward
Scaleup Stories 2020
Annexes 2020


Share