Explore the ScaleUp Annual Review 2020
Select a section to expand and explore this year's review..
CONTENTS

Introduction 2020

Chapter 1 2020
The Scaleup business landscape

Chapter 2 2020
Leading Programmes Breaking Down the Barriers for Scaleups

Chapter 3 2020
The local scaleup ecosystem

Chapter 4 2020
Shaping policy to foster UK scaleups: Breaking down barriers

Chapter 5 2020
Looking Forward

Scaleup Stories 2020

Annexes 2020
Scaleup indicators from a national and local perspective
Core to the ScaleUp Institute’s mandate is to work with others to grow and share the evidence available about scaling businesses in the UK. With accurate and timely analysis of more data, local communities and authorities, LEPs, regions, and stakeholders from the private and third sectors will be better able to target interventions that remove the barriers to scaleup growth.
The ScaleUp Institute undertakes detailed analysis of ONS data against three elements of the OECD high-growth (scaleup) definition1. These are:
- Scaleups growing by more than 20% per annum by employee growth
- Scaleups growing by more than 20% per annum by turnover growth
- Scaleups growing by more than 20% per annum in both employees and turnover.
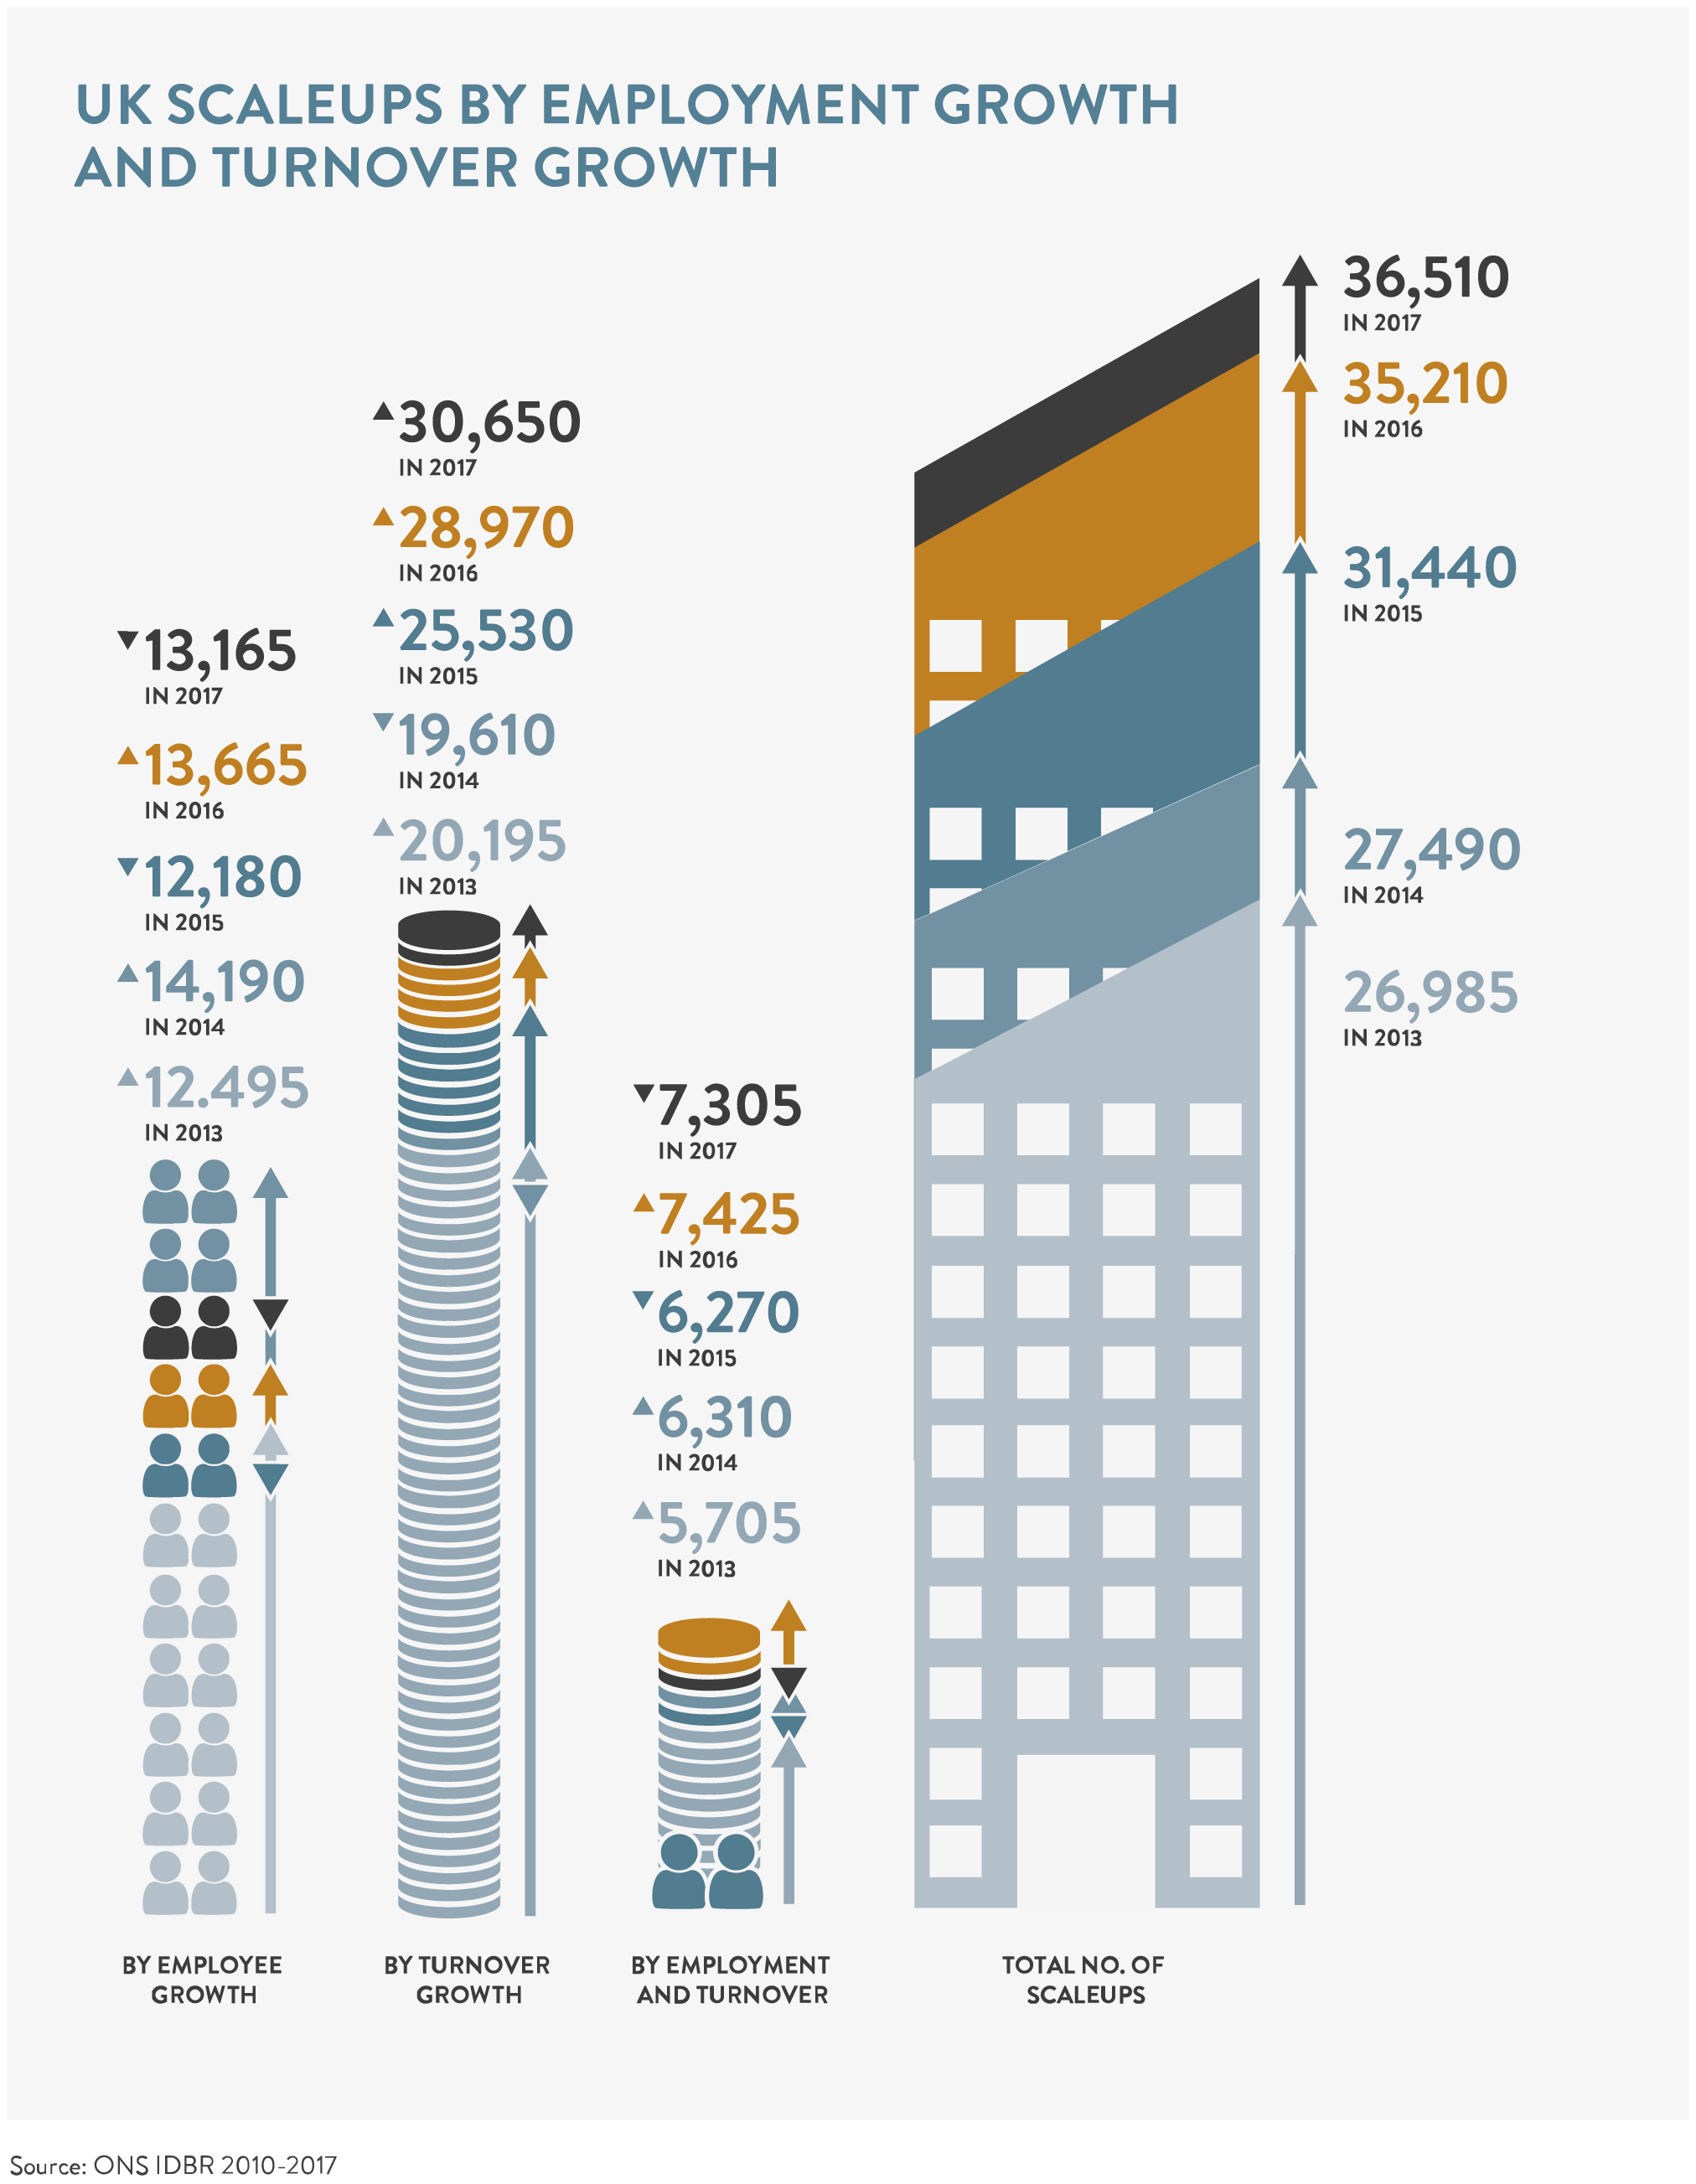
In March 2019 we published a deep-dive insight into the ONS data covering 2017, looking at the sectoral, local and national trends in scaleup populations. We showed that there were 36,510 scaleup businesses in 2017, an increase of 3.7% since 2016. Of these, 30,650 businesses were scaling their turnover, 13,165 businesses were scaling their employment, and 7,425 were scaling both their turnover and employment simultaneously.
Importantly, this growth has taken place across the country. For the first time ever, all regions of the UK are experiencing a growth rate of greater than 1 additional scaleup per 100,000 of population. On average, scaleups are 42% more productive than their peers. Encouragingly, we continue to see scaleup numbers increase across the breadth of the economy.
Whilst this growth rate in scaleup numbers is encouraging, it is crucial to note that the rate of growth has slowed from its average annualised rate of 9.3% between 2013 and 2016. Preliminary ‘snapshot’ data from the ONS provides an initial indication that 2018 may have seen a decline in the number of scaleups in the UK.
As this constitutes the first full year of data since the EU referendum of 2016 we will watch closely to see how the decision to leave the EU has affected scaleup confidence, their ability to scale and the ecosystem’s ability to evolve to meet scaling businesses needs. Given the importance of EU backed funding to the current scaleup ecosystem, the UK itself must find mechanisms to maintain this support.
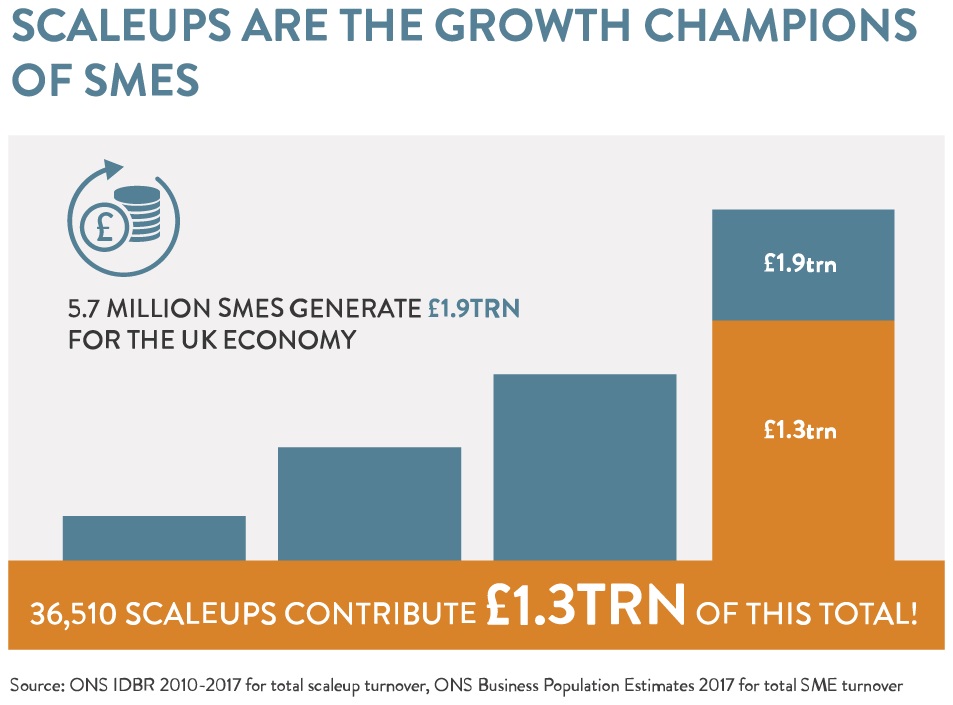
Scaleup turnover is substantial compared to total SME turnover
At a national level, the value that scaleups contribute to the UK economy remains substantial. Scaleups employed 3.4 million people in 2017, generating a total turnover of £1.3 trillion for the UK economy – for an average turnover per employee of £380,000, according to the ONS the total SME turnover in 2017 was £1.9 trillion. Scaleups are the vital 0.6% of our 5.7 million SMEs contributing nearly 70% of SME turnover output: emphasising the critical need for segmentation and tailored policy, solutions and services for scaling firms in our public, private and education sectors.
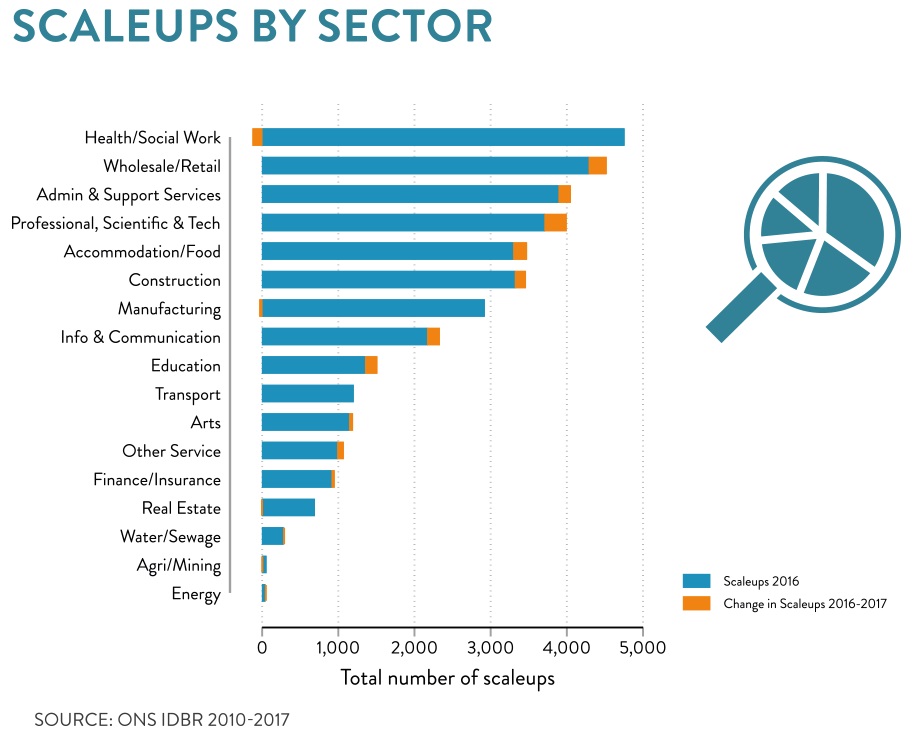
Scaleups are across all sectors of the economy
Using sectoral data from the ONS, we can see which sectors were responsible for the greatest scaleup growth. This data continues to show how scaleups in the UK exist across a broad range of sectors, with the Professional, scientific and technology sector showing the largest gains. Health and social work, the largest sector for scaleups, saw a slight decline in 2016-17 (following a large increase in 2015-2016).
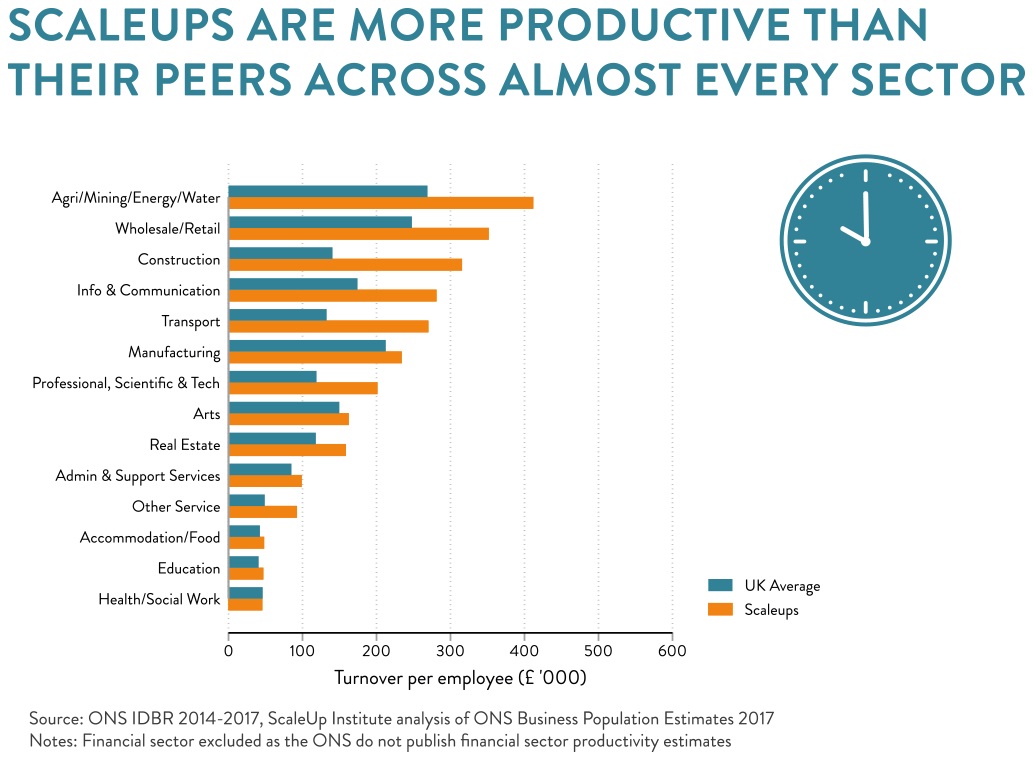
Scaleups are more productive than their peers across almost every sector
Scaleups continue to be more productive than their peers across almost every sector of the economy. On average scaleups were 42% more productive than their peers in the same sector, and in the construction and transport sectors scaleups were more than twice as productive as their peers.
Scaleups keep scaling: the lifecycle of a scaleup
In 2019, the ScaleUp Institute has conducted analysis on longitudinal datasets held by the ONS, allowing us to track individual firms over time, and get behind the nature of scaleups and how they grow. This data allowed us to look for the first time at how frequently firms scale, their typical size and growth characteristics, and their turnover.
Using the Business Structure Database, a longitudinal dataset containing information on more than 99 per cent of economic activity in the country, we followed and analysed the UK’s scaleups since 2001, looking at the way they have scaled, their turnover and the number of employees they have. ‘Scaling’ here refers to a three year period where the growth rate exceeded 20% per year on average, allowing overlapping periods.
This analysis revealed the following key points:
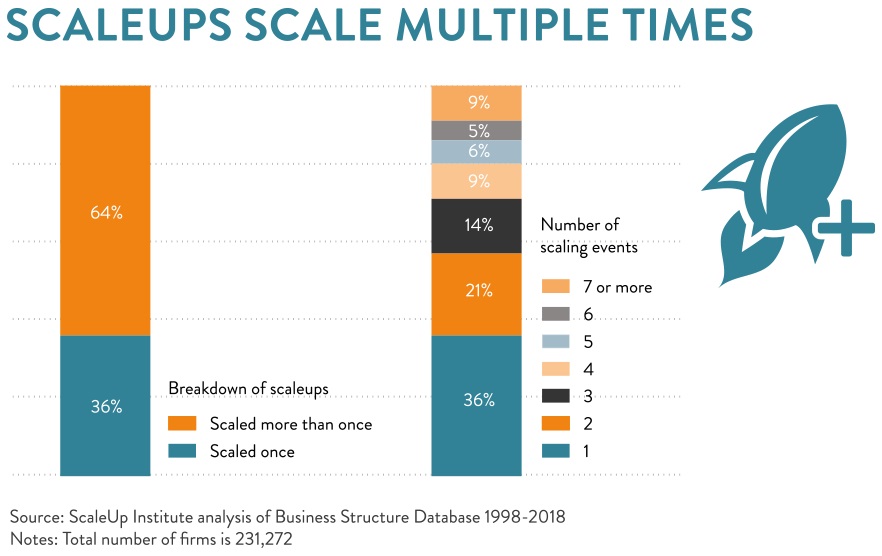
- Scaleups keep scaling. Two thirds of scaleups scaled more than once over the period, with 43% scaling three or more times.
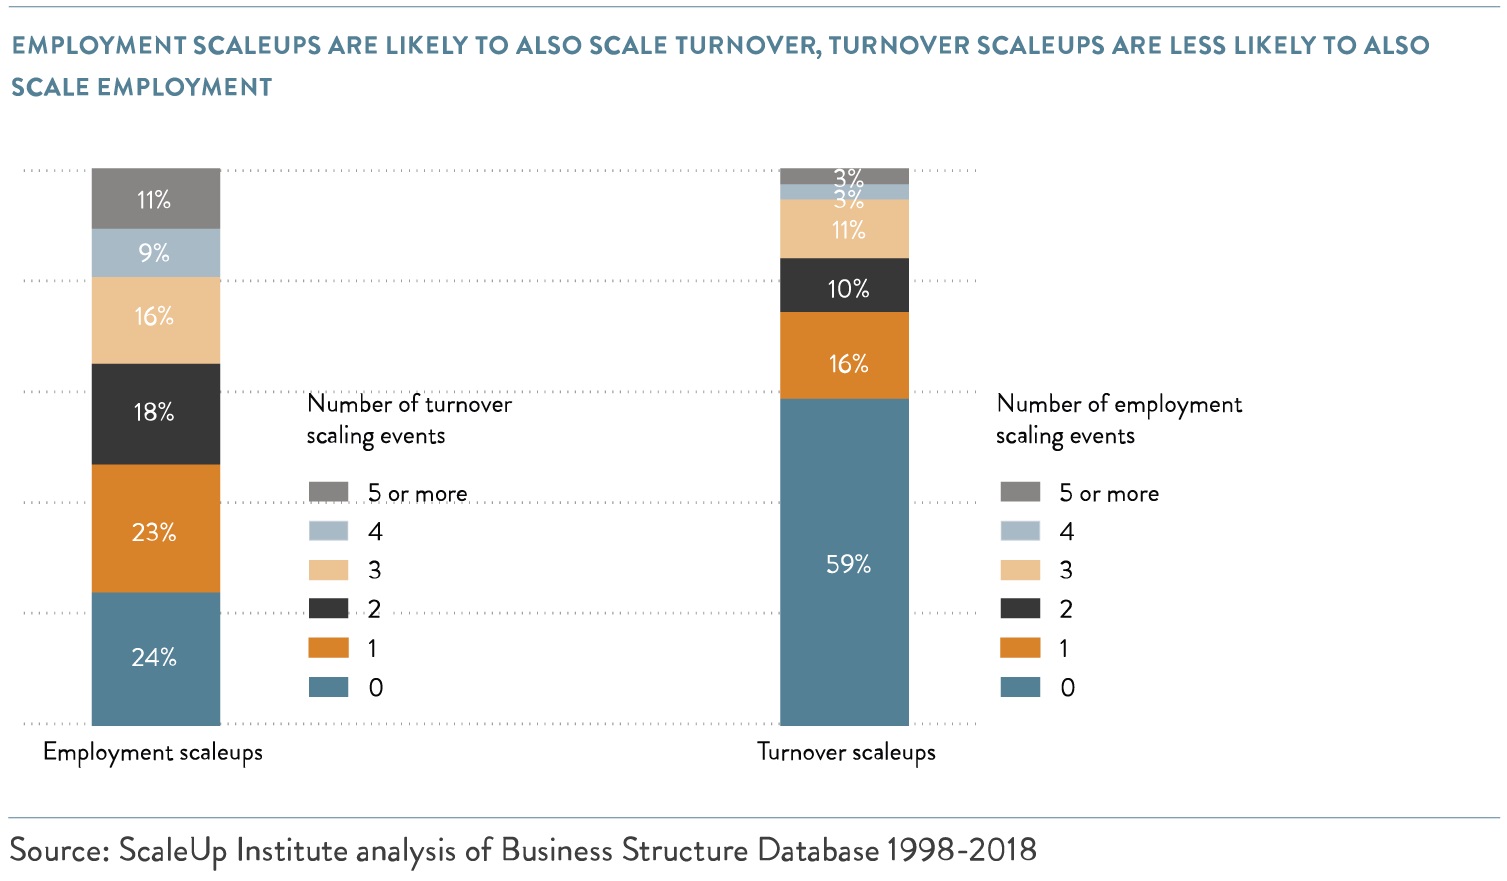
- Turnover scaleups were likely to scale turnover repeatedly, and employment scaleups were likely to scale employment repeatedly.
- Most employment scaleups scaled their turnover. Three quarters of employment scaleups also scaled turnover at least once over the period – however the same was not true of turnover scaleups, where a lower proportion scaled employment.
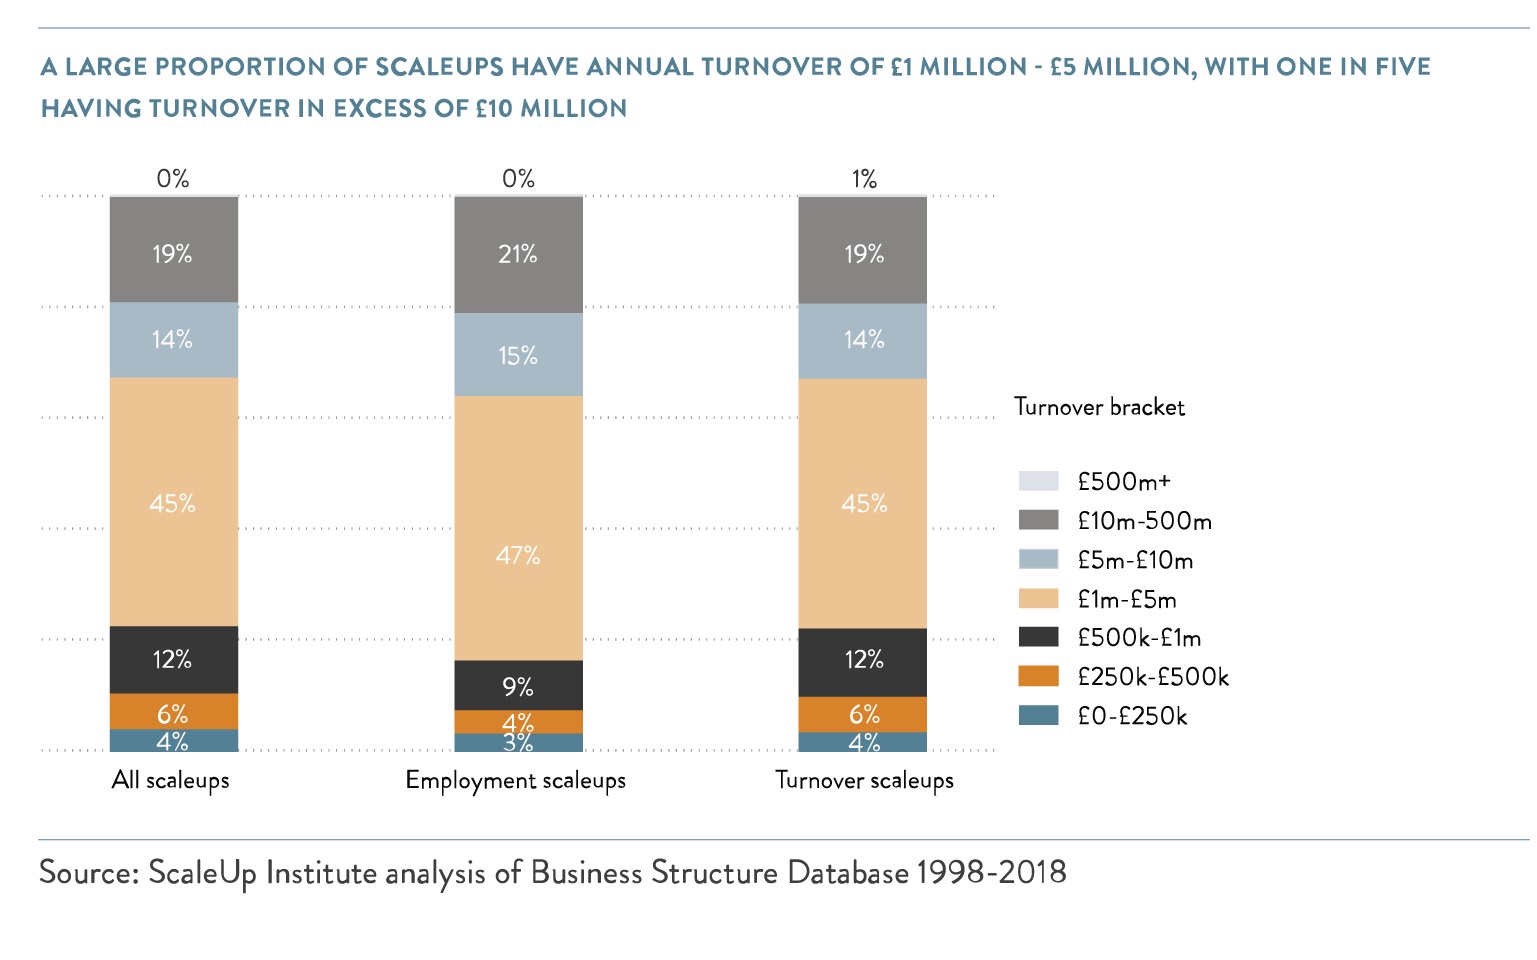
- Scaleups have a typical turnover of £1 million – £5 million per annum. 63% of scaleups fall into this turnover range, with 19% having turnover in excess of £10 million per annum.
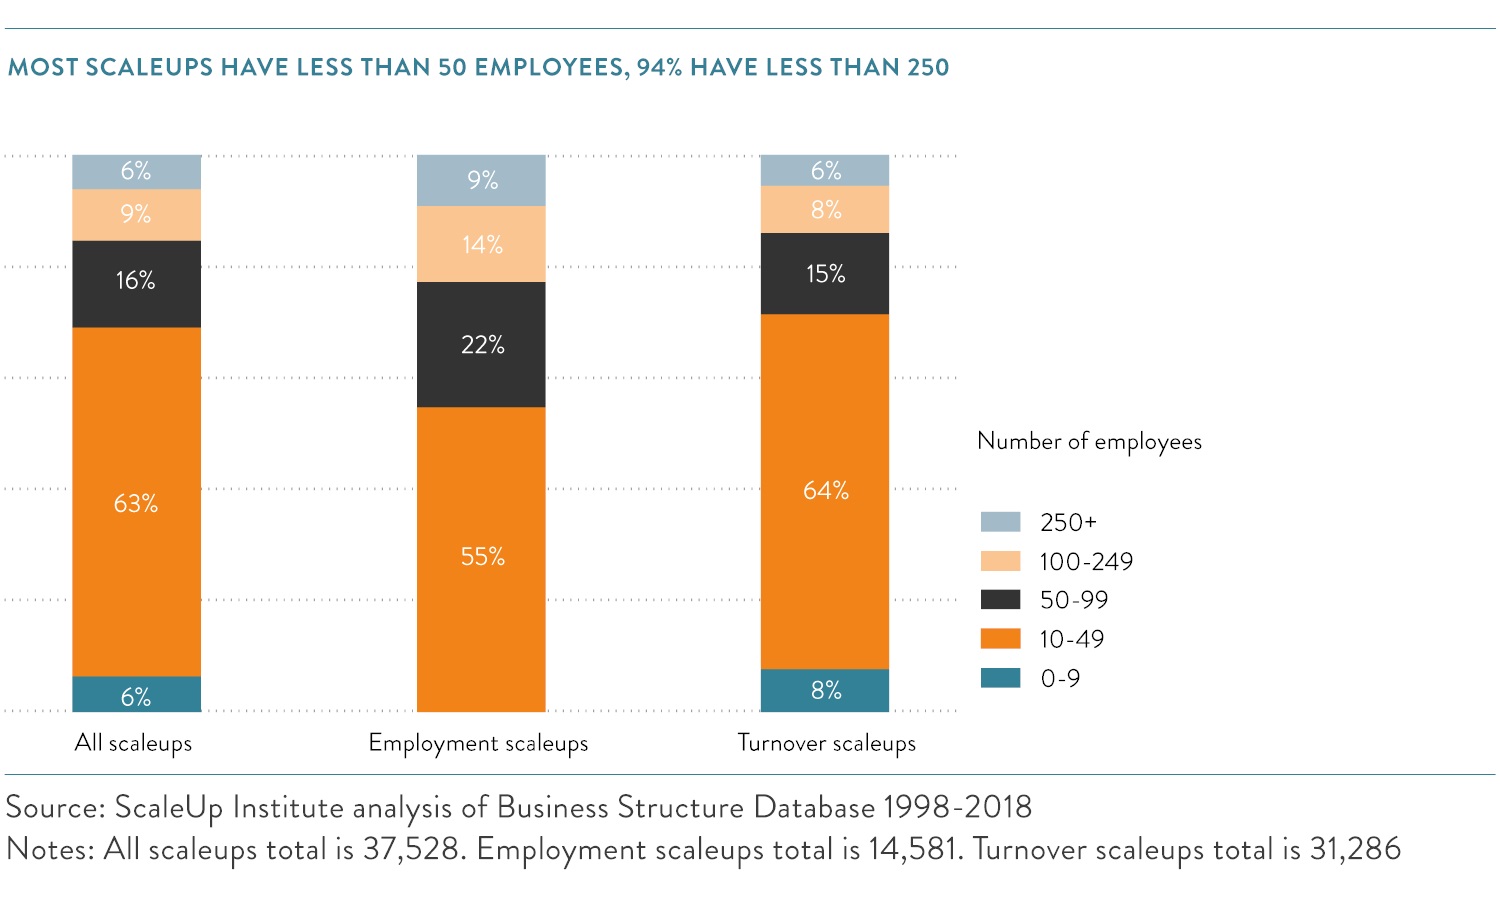
- Most scaleups have between 10 and 50 employees. This holds true looking at employment or turnover scaleups, and unsurprisingly employment scaleups have larger workforces than turnover scaleups. Only 6% of scaleups have more than 250 employees.
LOCAL ANALYSIS OF SCALEUP POPULATIONS AND GROWTH RATES
Alongside these national dynamics, it is important to highlight the significant local variations in scaleup success.
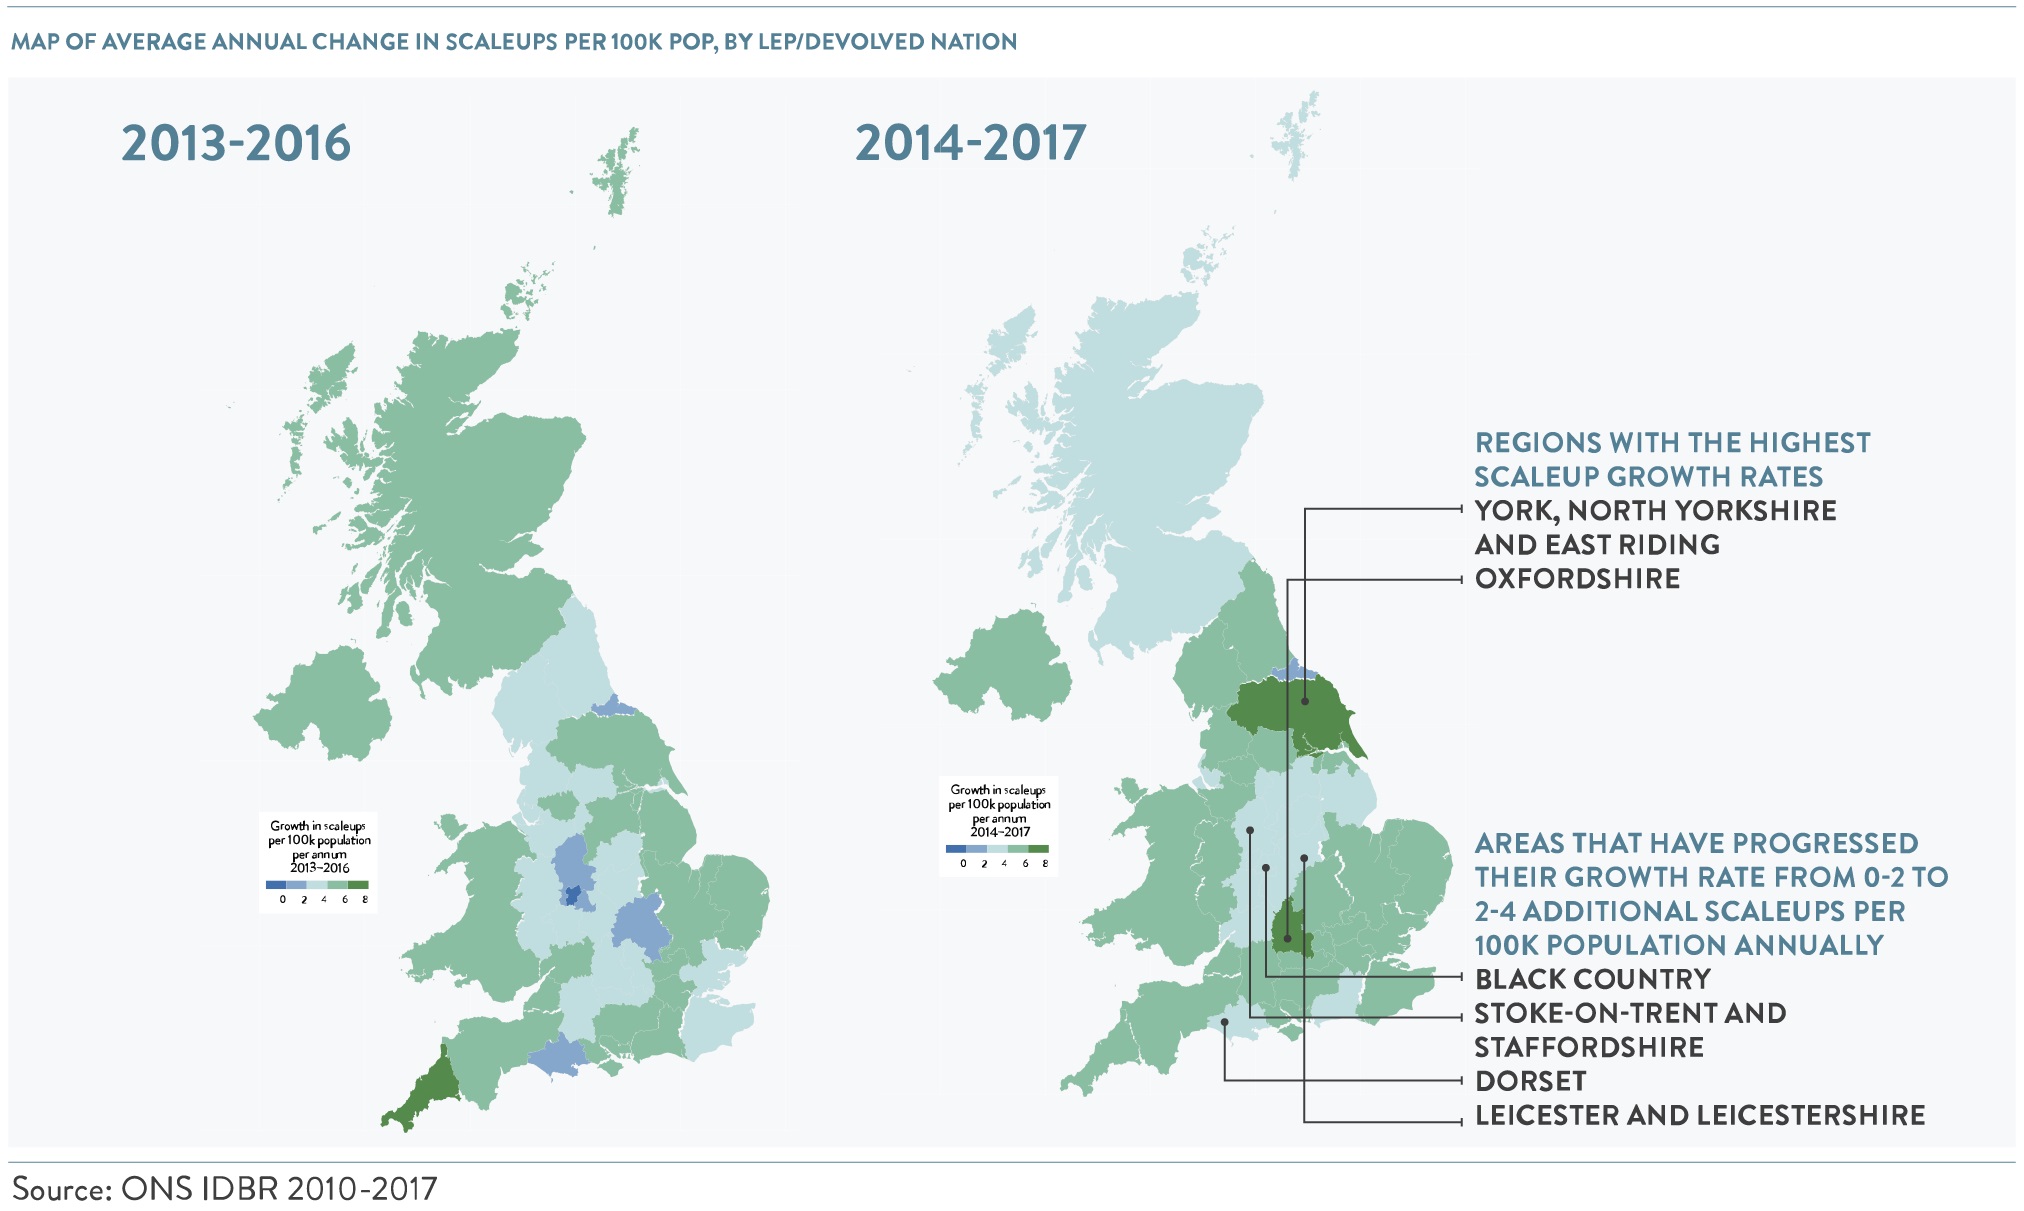
The growth in scaleups at a local level is illustrated in the maps below, with areas of a more fertile green exhibiting higher growth and areas of blue showing slower growth or decline in scaleup populations. Relative to last year, there are fewer regions of slower growth, and the areas of highest growth are now Oxfordshire and York, North Yorkshire and East Riding.
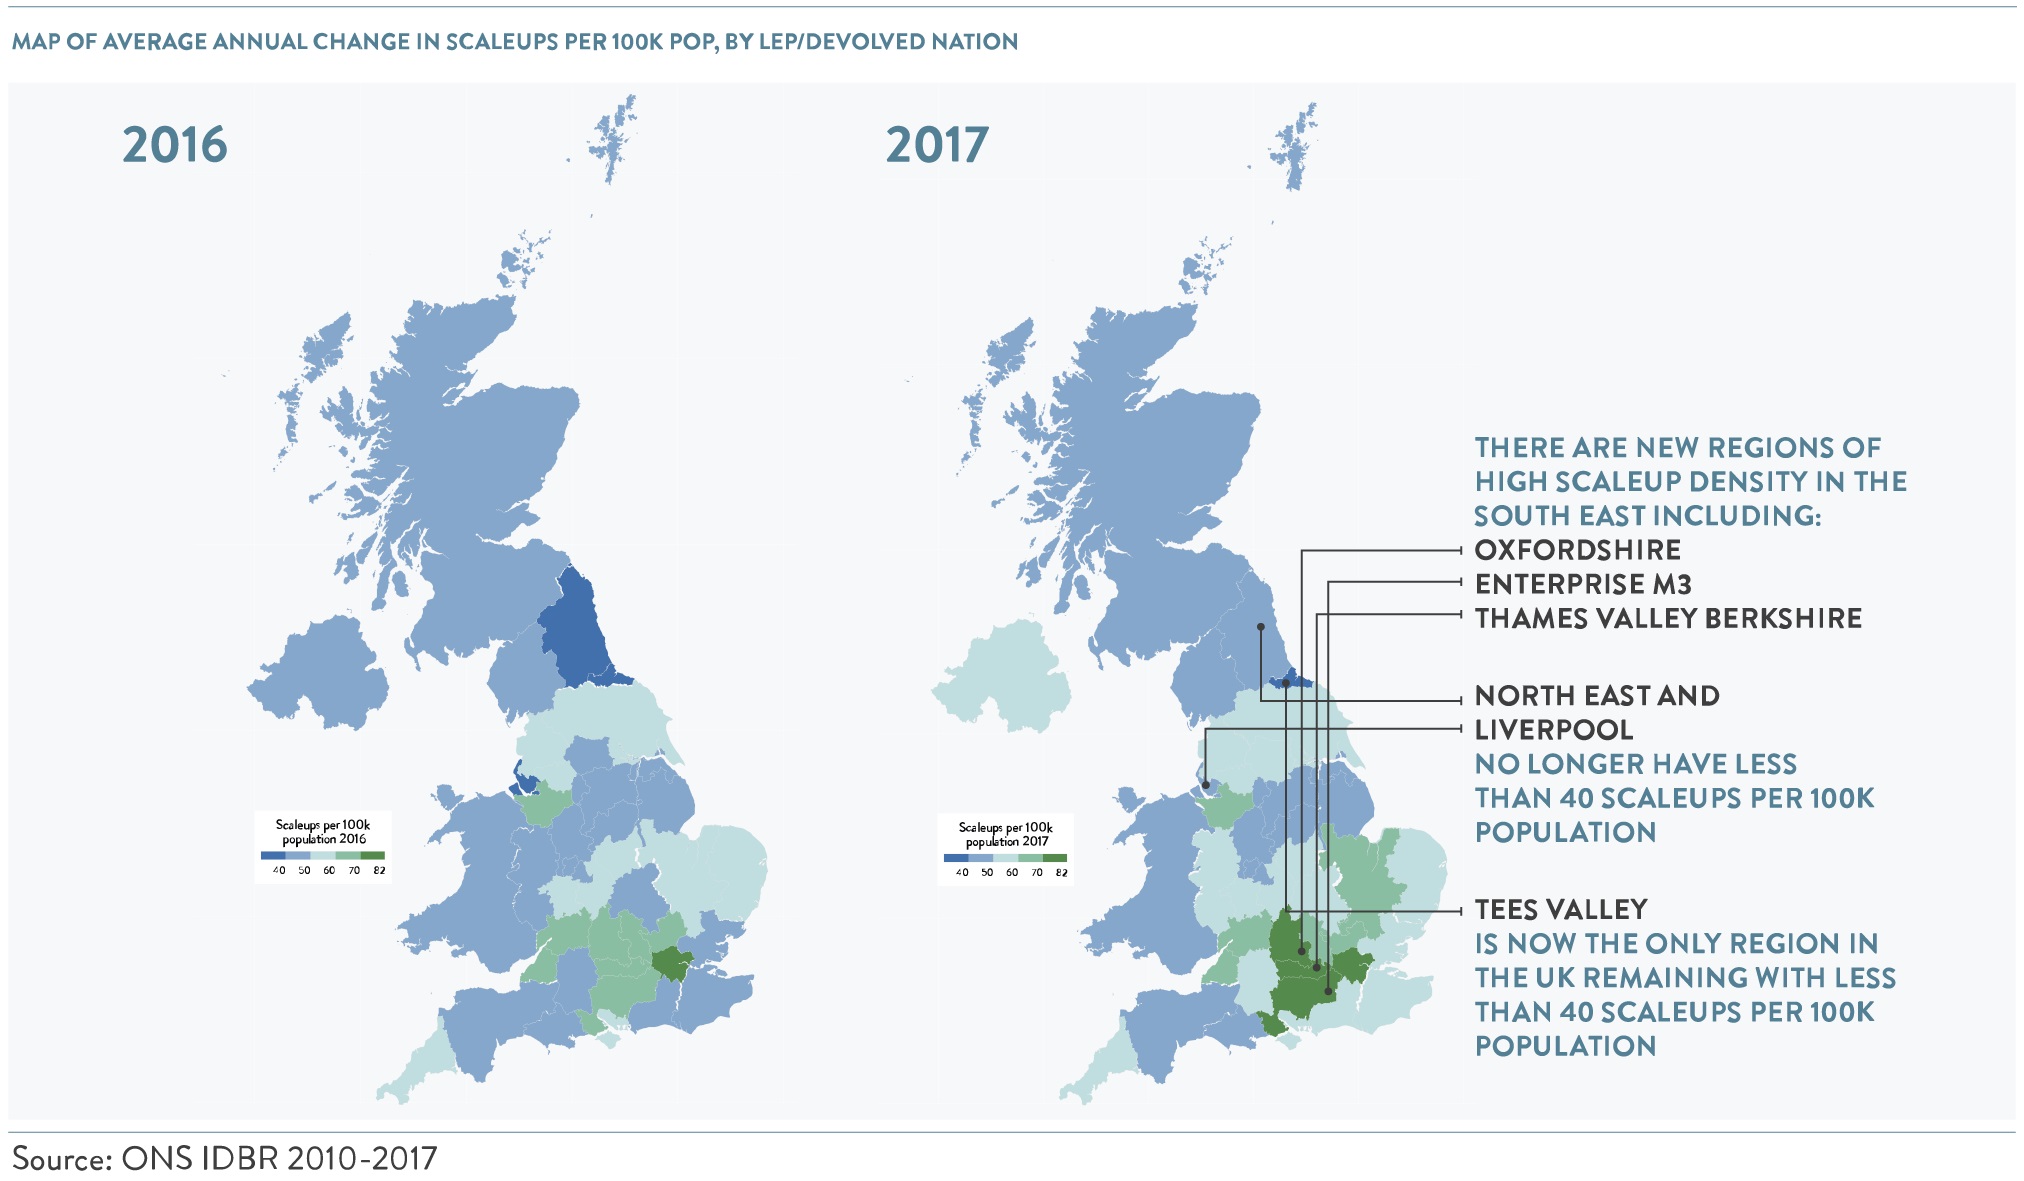
The maps below show the variation in the absolute number of scaleups, adjusted for population. This highlights the continued development of high scaleup populations in the South East of England, as well as the North East’s recent progress in increasing its scaleup population.
Local scaleup growth rates and trends
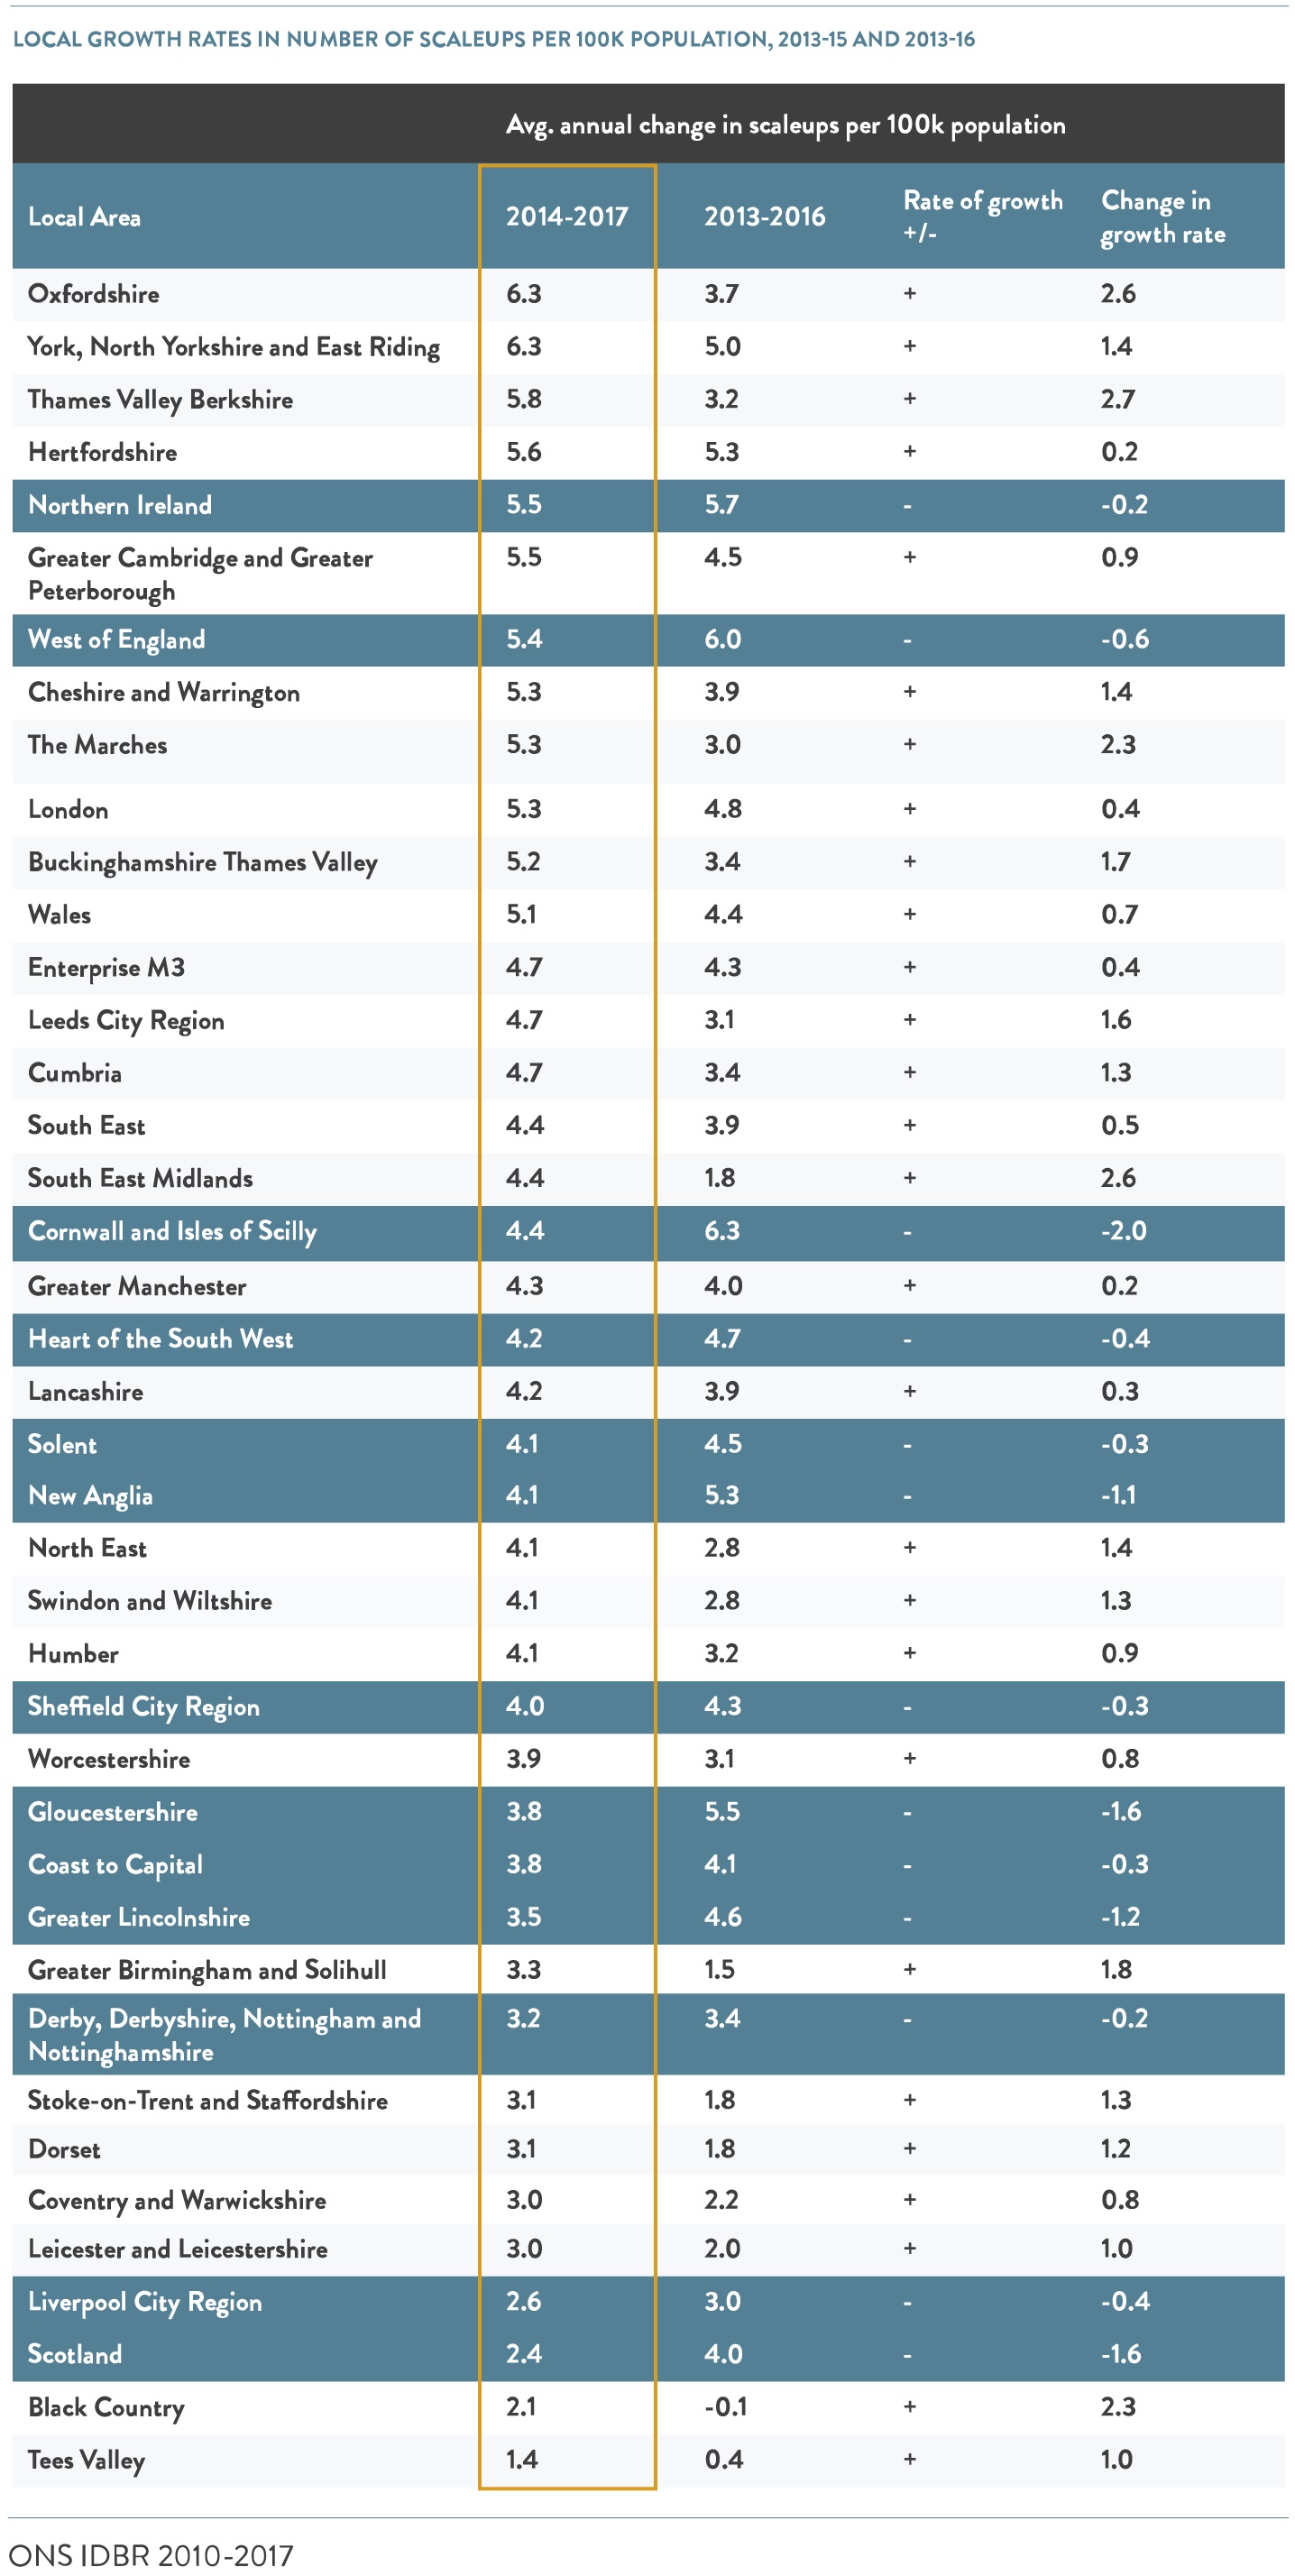
Looking across the 38 LEPs and 3 devolved nations, 2017 data shows significant changes across the UK. The table below shows how the growth rate in scaleups has changed, highlighting that in 28 out of 41 local areas the growth rate has increased relative to its 2013-2016 rate.
Whilst there has been movement within the table, the leading local areas remain broadly the same as last year. The main trends are:
- Of the top 20 local areas based on the 2014-2017 growth rate, 13 were also in the top 20 local areas based on the 2013-2016 growth rate.
- The new seven additions to the top 20 were Buckinghamshire Thames Valley, Cumbria, Leeds City Region, Oxfordshire, South East Midlands, Thames Valley Berkshire and The Marches.
- The local areas rising most in the growth rankings from 2016 to 2017 were Thames Valley Berkshire (rising 24 places), The Marches (rising 22 places), and Oxfordshire (rising 21 places).
- The local areas falling the most in the rankings were Gloucestershire, Scotland and Greater Lincolnshire.
- Five local areas were in the top 10 for growth in both 2017 and 2016: West of England, London, Northern Ireland, Hertfordshire, and York, North Yorkshire and East Riding.
To get behind the socioeconomic links to these changes, we have conducted an initial analysis of the underlying factors surrounding scaleup growth which is summarised overleaf.
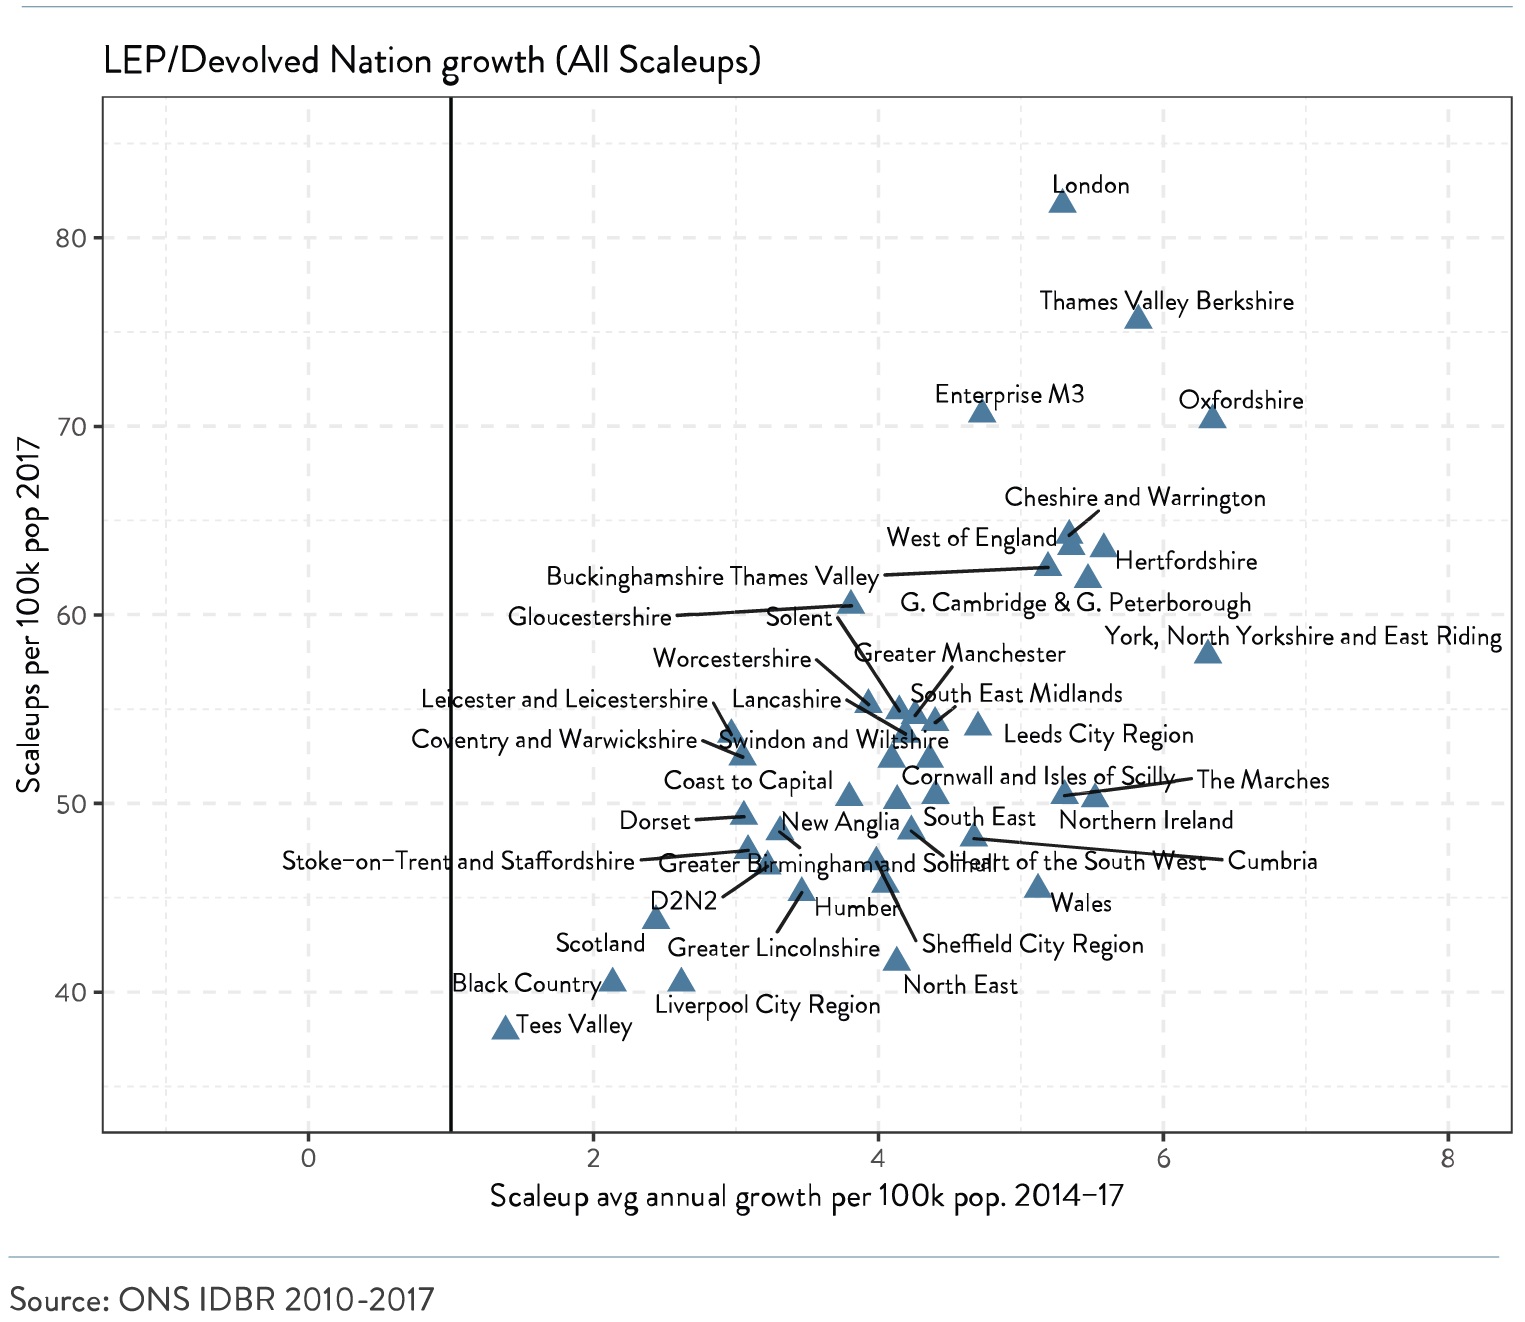
The latest data shows that there are no scaleup ‘cold spots‘ – local areas showing annual growth of less than one scaleup per 100,000 of population. However, some regions are only marginally above the threshold and variation in scaleup growth across the LEPs persists. Much more remains to be done.
LOCAL PATTERNS ON TURNOVER AND EMPLOYMENT SCALEUPS
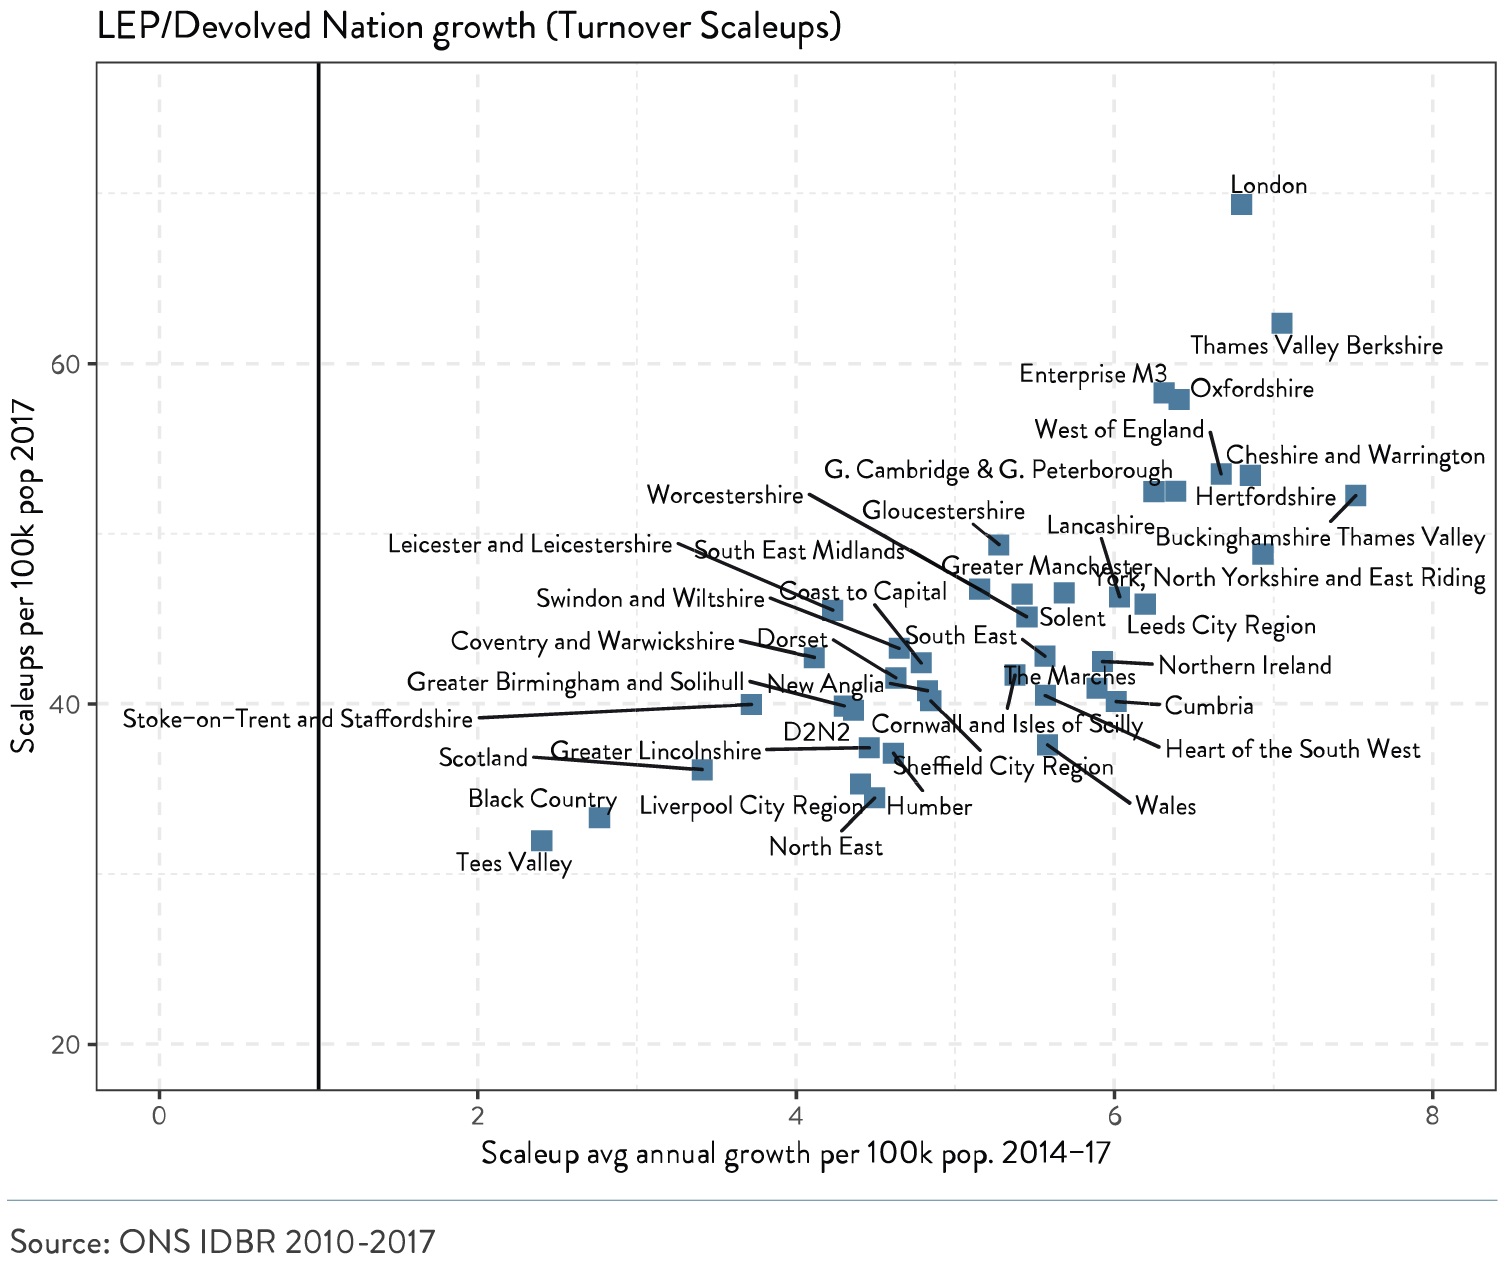
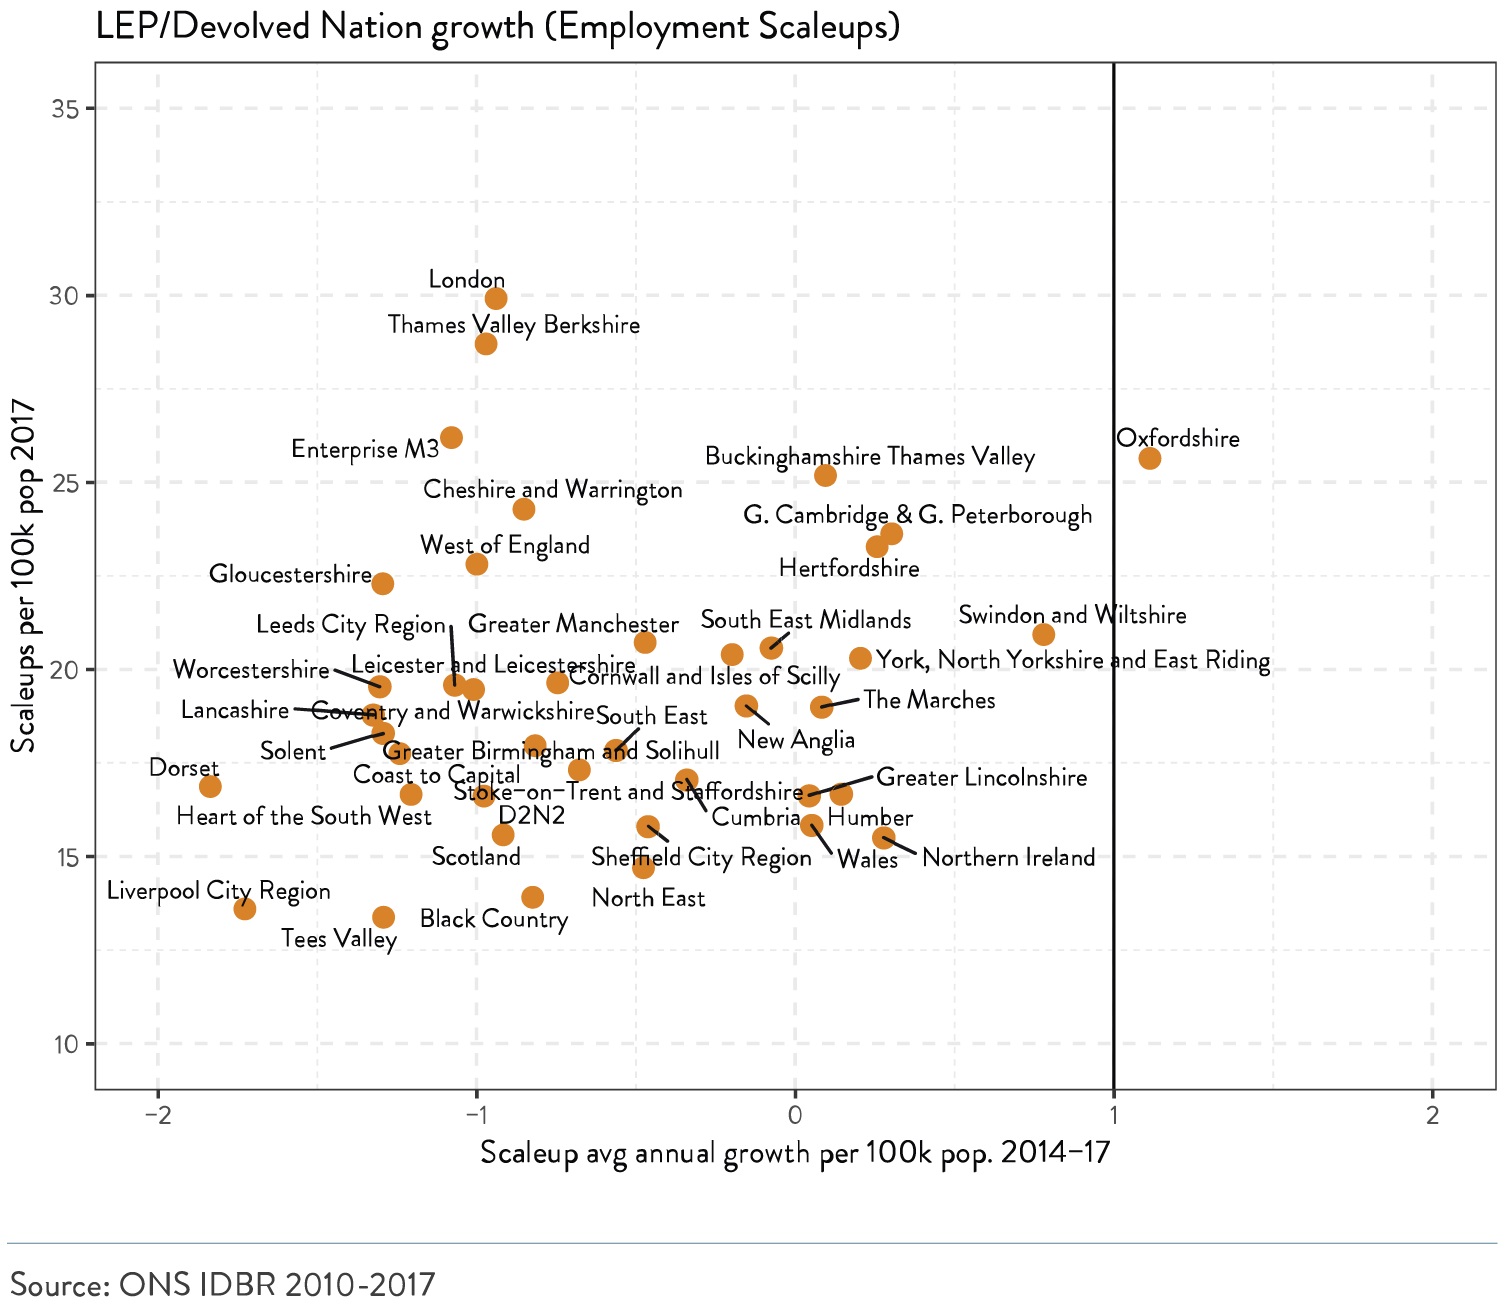
The top 5 LEPs for growth in turnover scaleups were Buckinghamshire Thames Valley, Thames Valley Berkshire, York, North Yorkshire and East Riding, Cheshire and Warrington and London. The top 5 LEPs/devolved nations for growth in employment scaleups were Oxfordshire, Swindon and Wiltshire, Greater Cambridge and Greater Peterborough, Northern Ireland and Hertfordshire, although growth in employment scaleups has been relatively weak, with only Oxfordshire growing at a rate of greater than +1 scaleup per 100k population per annum. These growth rates and scaleup densities for local authorities are shown in the charts below.
LOCAL AUTHORITY PICTURE
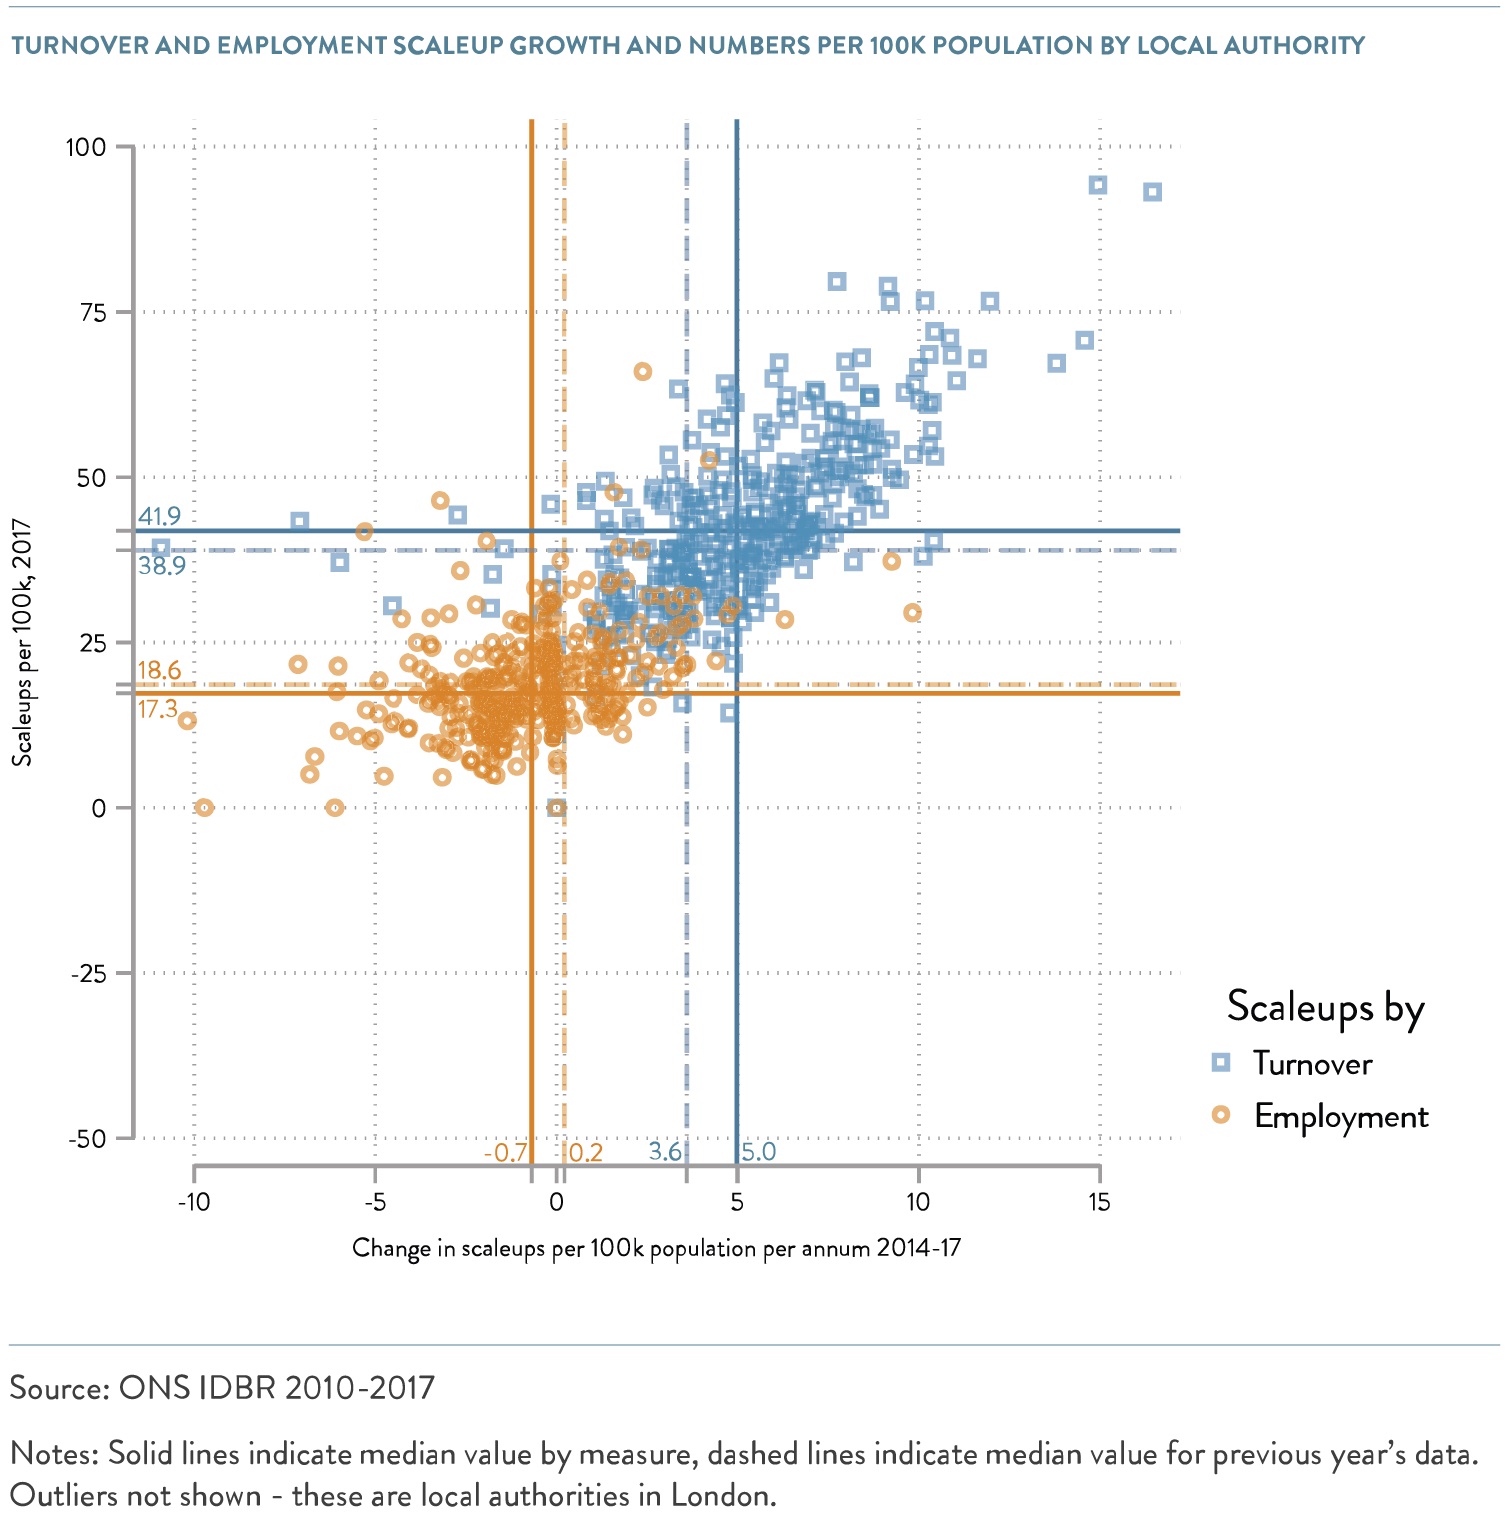
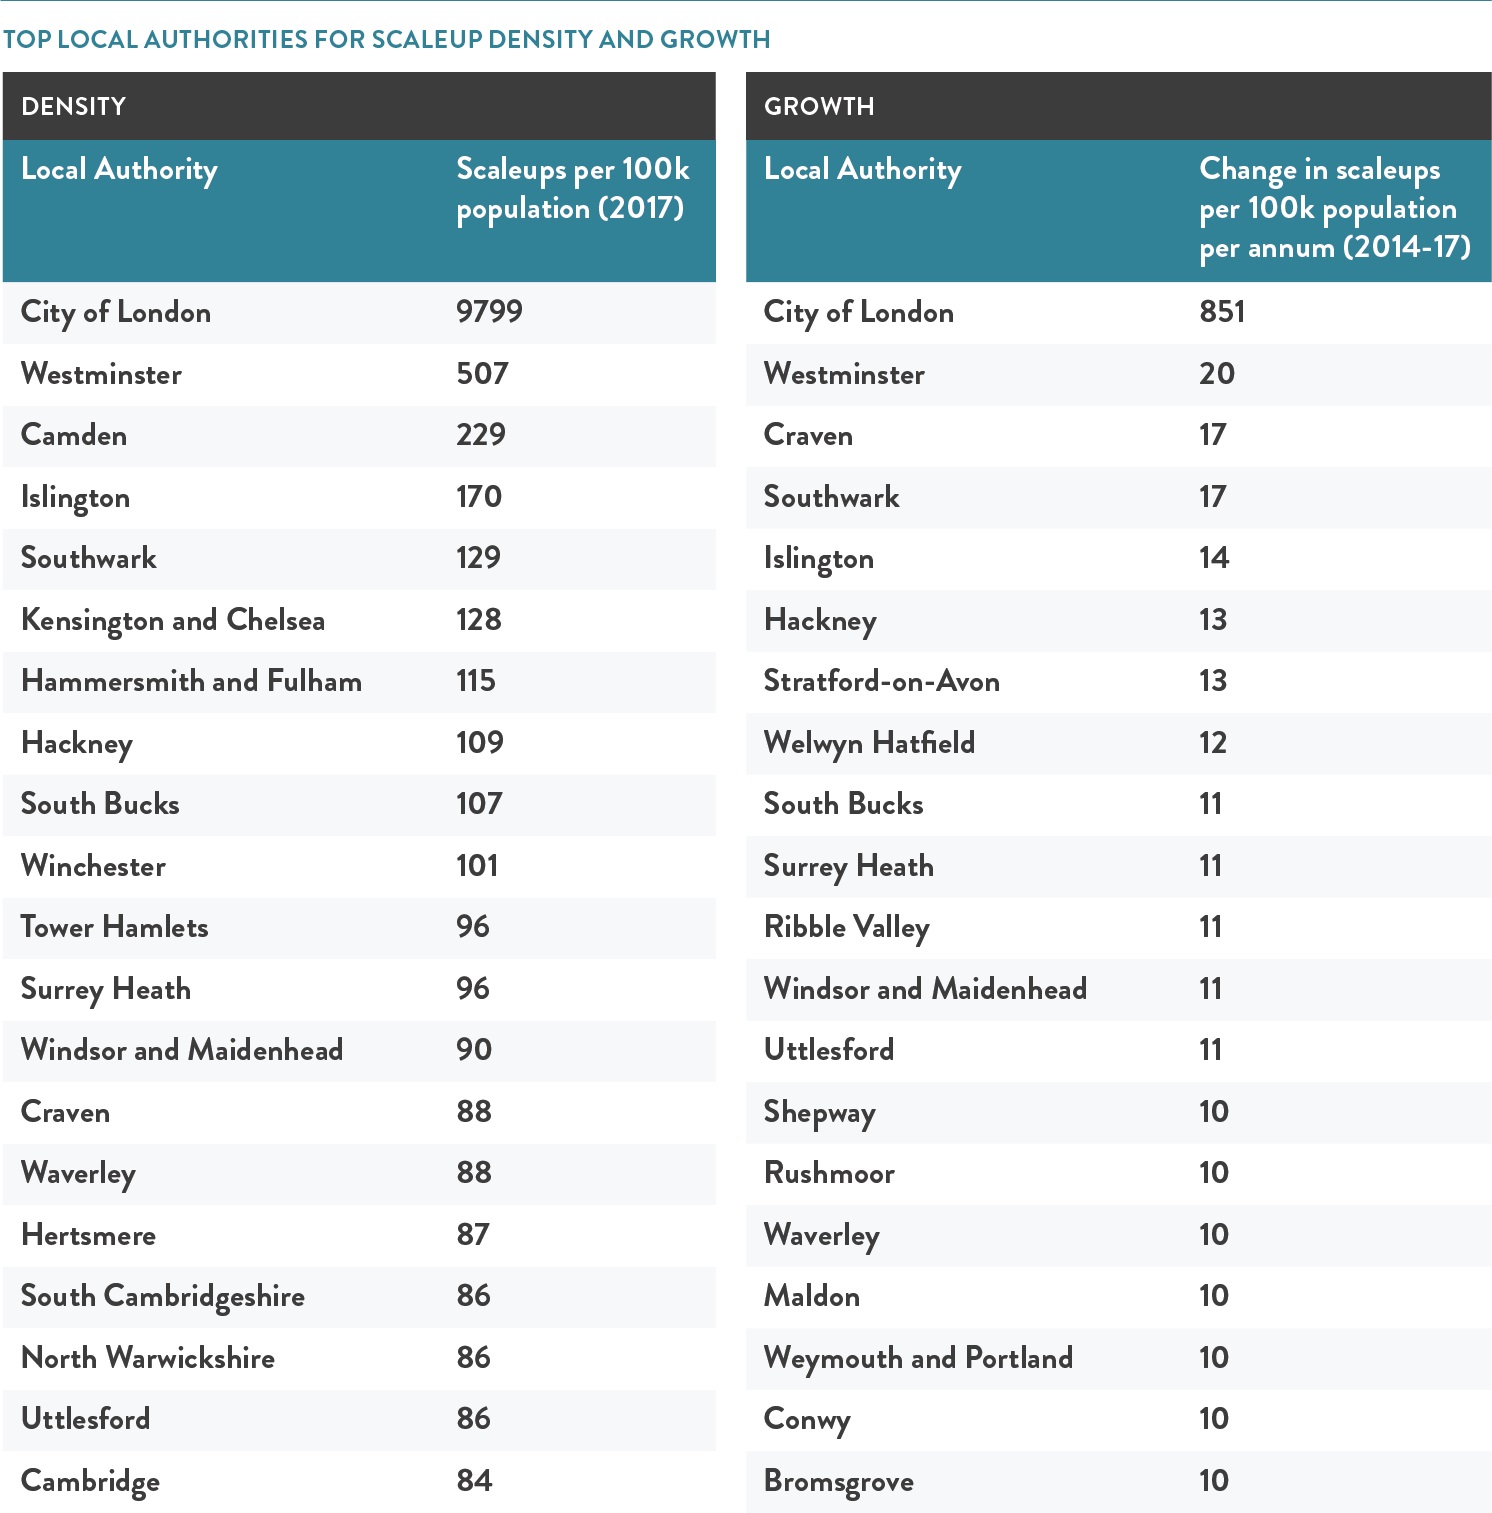
Looking at an even more granular Local Authority level, further regional disparities are highlighted. The number of scaleups per 100,000 of population varies widely among local authorities – from less than 20 in the Isles of Scilly, West Somerset, West Dunbartonshire and Clackmannanshire to more than 100 in Winchester, South Bucks and several local authorities in London. The figure below plots the number of employment and turnover scaleups by local authority against the growth rate.
Across the UK, none of the 381 local authorities had more employment scaleups than turnover scaleups. The median growth rate and density for turnover scaleups has increased substantially since last year (shown by the dashed and solid blue lines in the chart below) while there were declines in the media density and growth rate for employment scaleups.
Page URL: https://www.scaleupinstitute.org.uk/articles/scaleup-indicators-from-a-national-and-local-perspective/
CONTENTS

Introduction 2020

Chapter 1 2020
The Scaleup business landscape

Chapter 2 2020
Leading Programmes Breaking Down the Barriers for Scaleups

Chapter 3 2020
The local scaleup ecosystem

Chapter 4 2020
Shaping policy to foster UK scaleups: Breaking down barriers

Chapter 5 2020
Looking Forward

Scaleup Stories 2020

Annexes 2020

 Previous

Share