Explore the ScaleUp Annual Review 2021
Select a section to expand and explore this year's review.
CONTENTS

Introduction 2021

Chapter 1 2021
The ScaleUp Business Landscape

Chapter 2 2021
Leading Programmes Breaking Down the Barriers for Scaleups

Chapter 3 2021
The Local Scaleup Ecosystem

Chapter 4 2021
The Policy Landscape

Chapter 5 2021
Looking forward

Annexes 2021

Scaleup Stories 2021
Scaleup indicators from a national and local perspective
At the core of the ScaleUp Institute’s mandate is working collaboratively to progress and share the evidence about the scaleup business ecosystem in the UK. Accurate and timely analysis of data from new and existing sources, can help local communities and authorities, LEPs, regions, and stakeholders from the private and third sector to better position interventions removing the barriers to scaleup growth.
The ScaleUp Institute with the collaboration of the Office for National Statistics has undertaken a detailed analysis of the ONS 2019 data – the most recent available – against three elements of the OECD high-growth (scaleup) definition. These include the following:
- Scaleups growing by more than 20% per annum by employee growth
- Scaleups growing by more than 20% per annum by turnover growth
- Scaleups growing by more than 20% per annum in both employees and turnover.
In 2021, the ScaleUp Institute has continued to explore the trends in the data on scaleups and on the scaling pipeline, who are growing their turnover and/or employee headcount by between 15 and 19.99%. We present new insights on sectoral clusters of scaleups around the country and trends over time for the scaling pipeline.
Analytical note: In 2021 the boundaries between 17 LEPs in England were adjusted to remove overlaps between areas that have existed since their formation. The data presented in the local analysis below reflects the new boundaries published by ONS in October 2021. This has resulted in some changes to absolute number and density of scaleups found in the affected LEPs and therefore in these cases local results are not comparable with numbers published in previous Annual ScaleUp Reviews which are based on former LEP boundaries. UK-wide scaleup numbers and trends are unaffected by these changes.
The ScaleUp Landscape
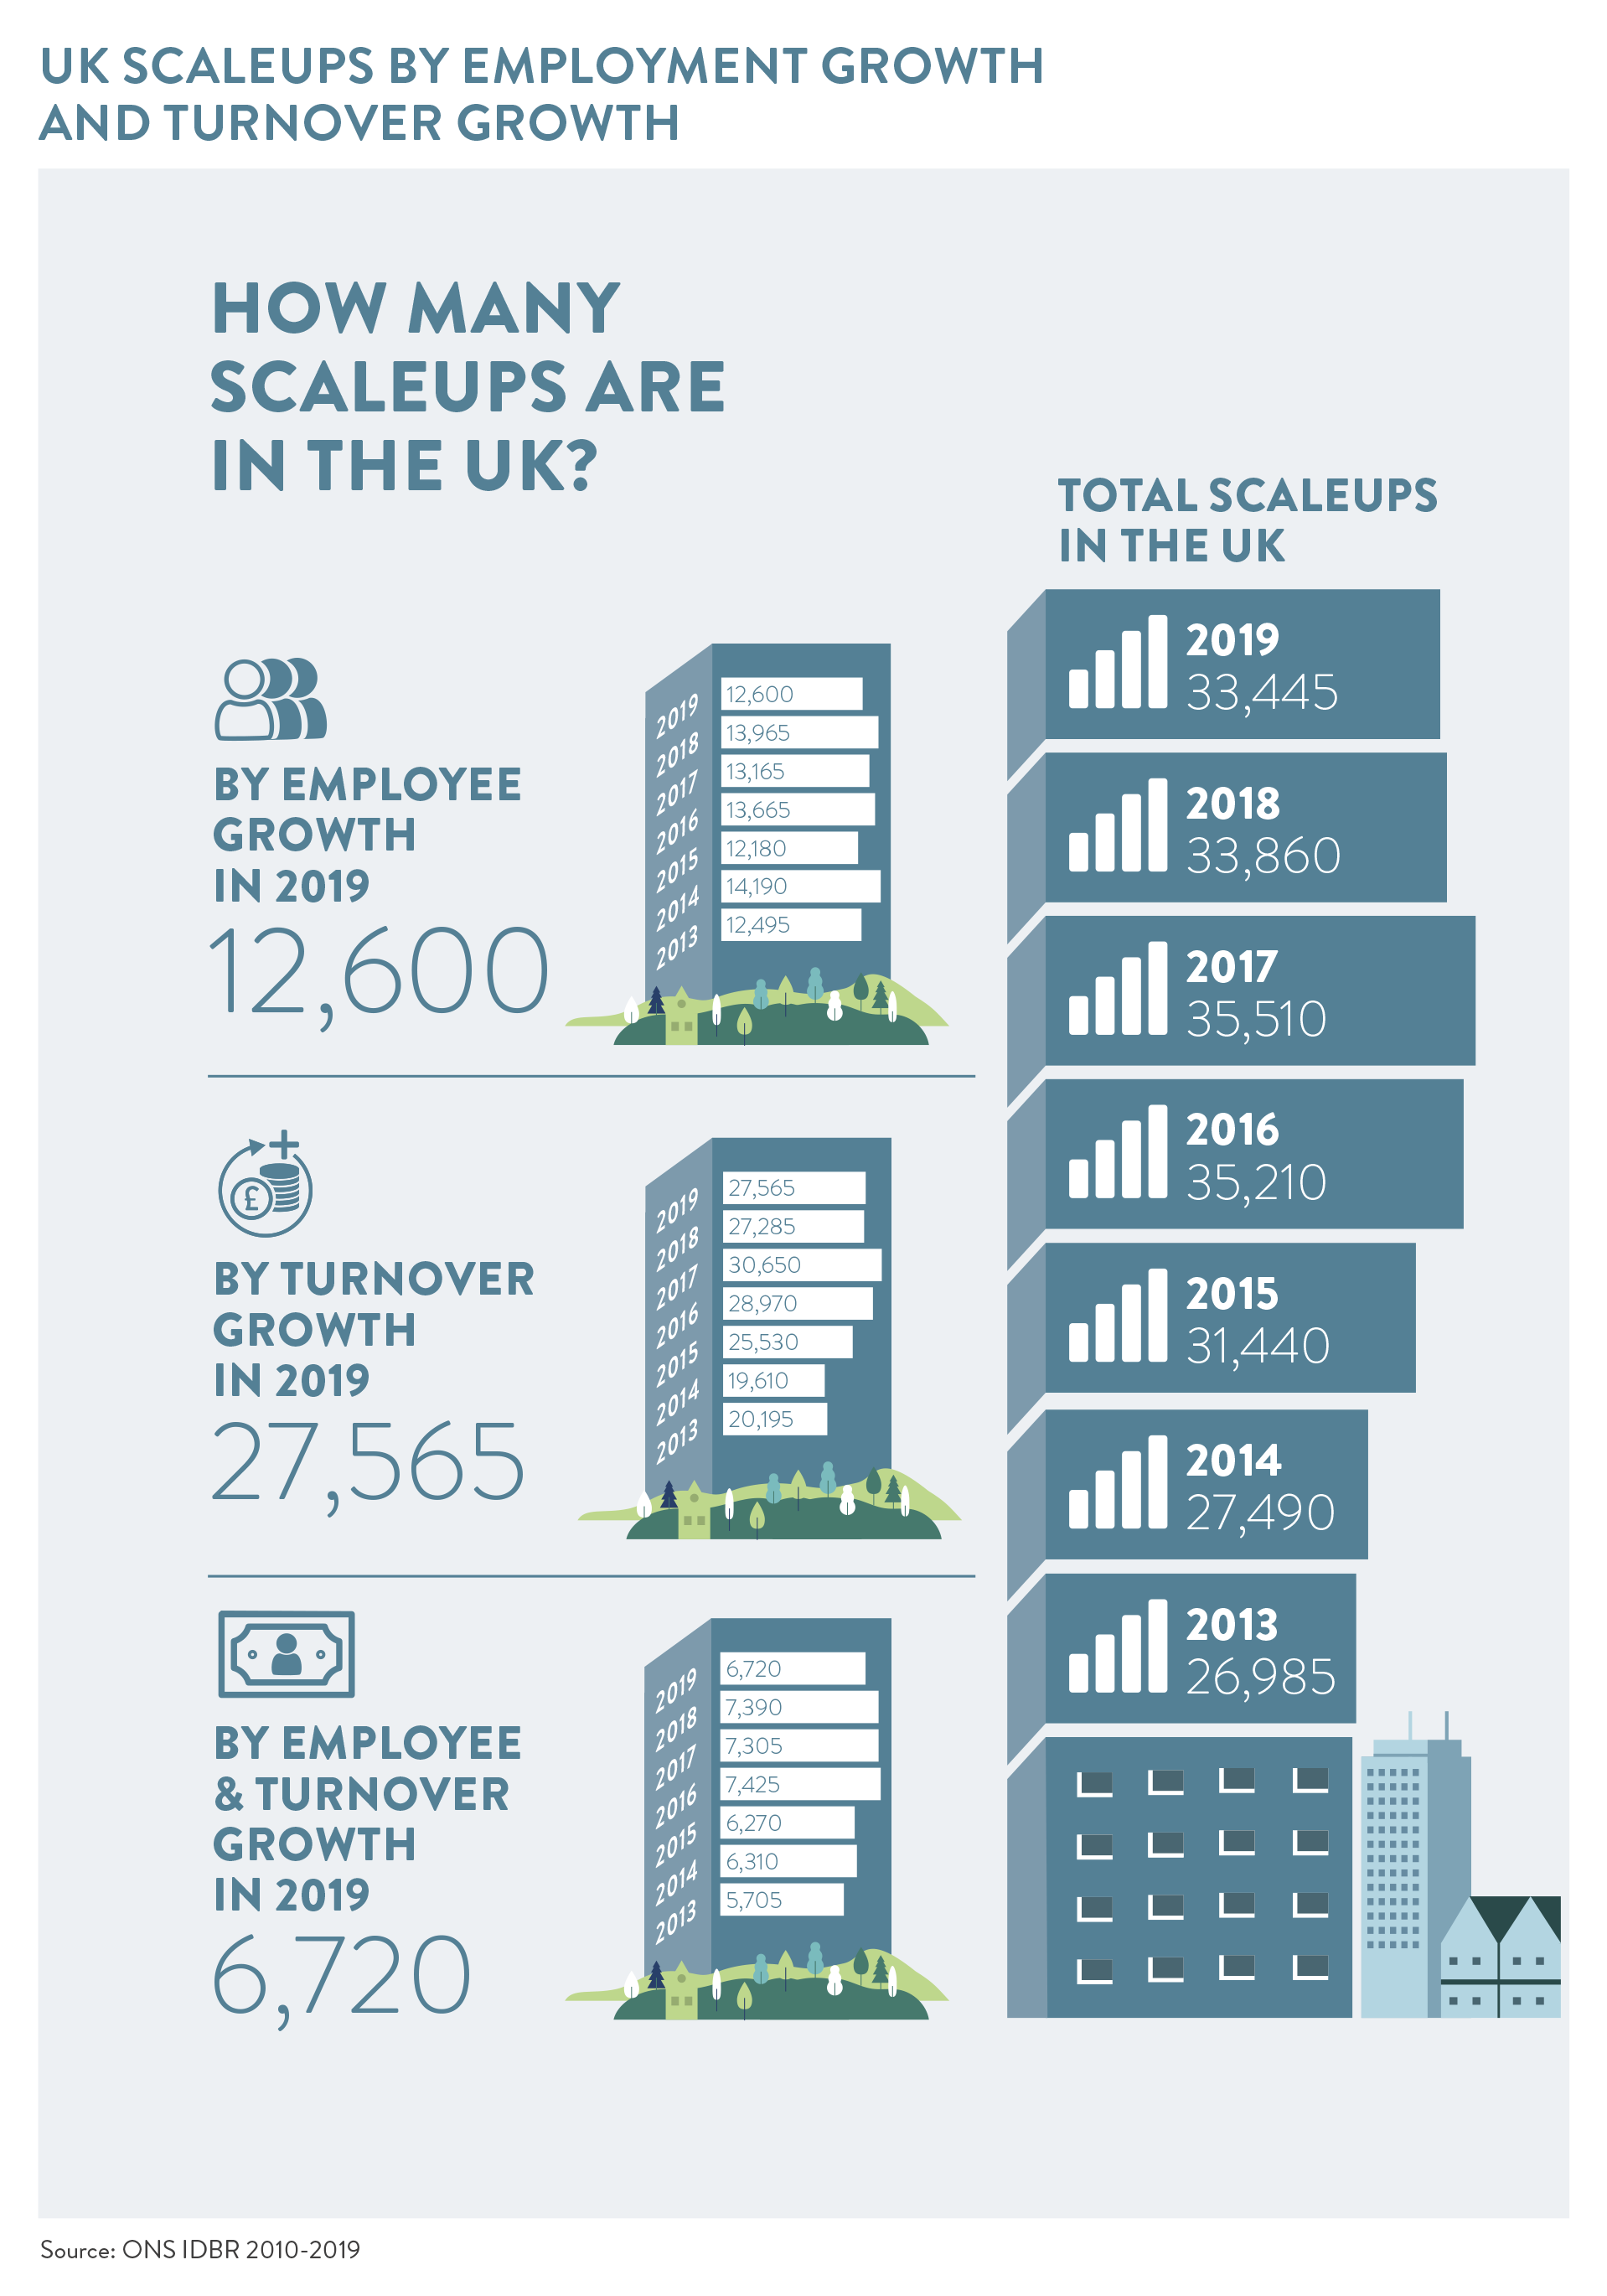
The ScaleUp Institute’s analysis of the latest ONS data showed that in 2019 there were 33,445 scaleups in the UK – 24% higher than in 2013 but 1% down year on year from 2018 to 2019.
This slowdown of scaleup growth is the result of a 10% drop in the number scaling by employment and a 9% drop in the number scaling by both employment and turnover. Although the number of scaleups growing by turnover remained steady in 2019 at 27,565 – 1% above the 2018 figures – this small decline in the overall number of scaleups may reflect ongoing global uncertainty as well as the intensifying Brexit dynamics and the rising concerns among scaleups around market access.
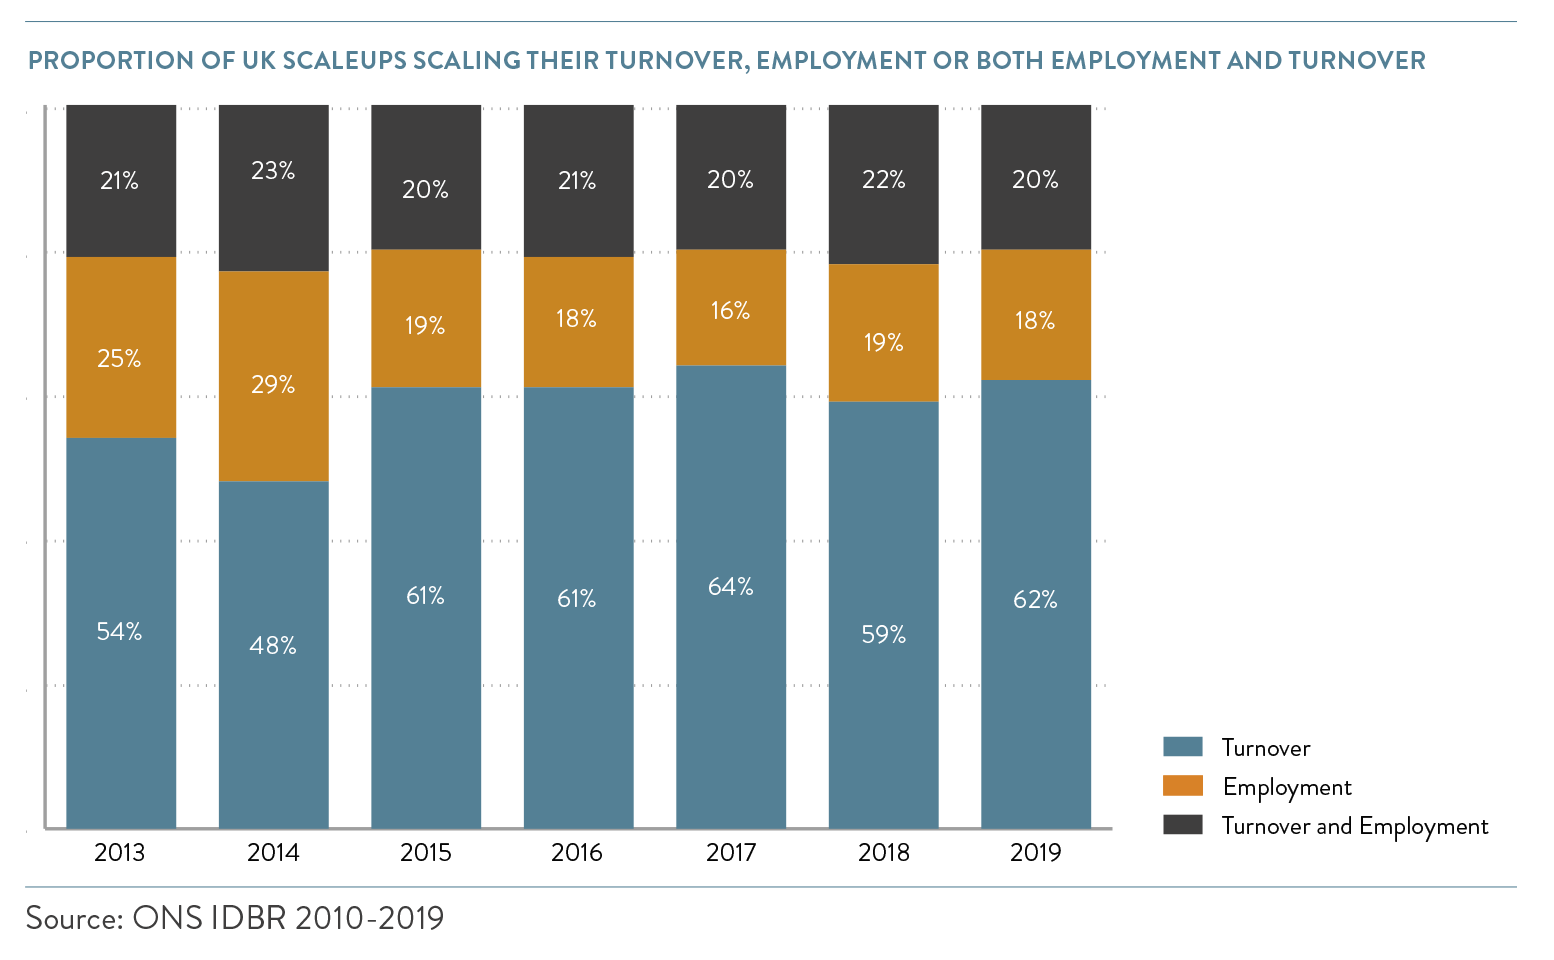
Over a 5 year period we see those scaling by both turnover and employment changed marginally from 22% to 20%. Those scaling by employment fell slightly 19% to 18%. However, a slightly higher proportion were scaling by turnover (59% to 62%).
Scaleup remain the growth champions of SMEs but there is no room for complacency
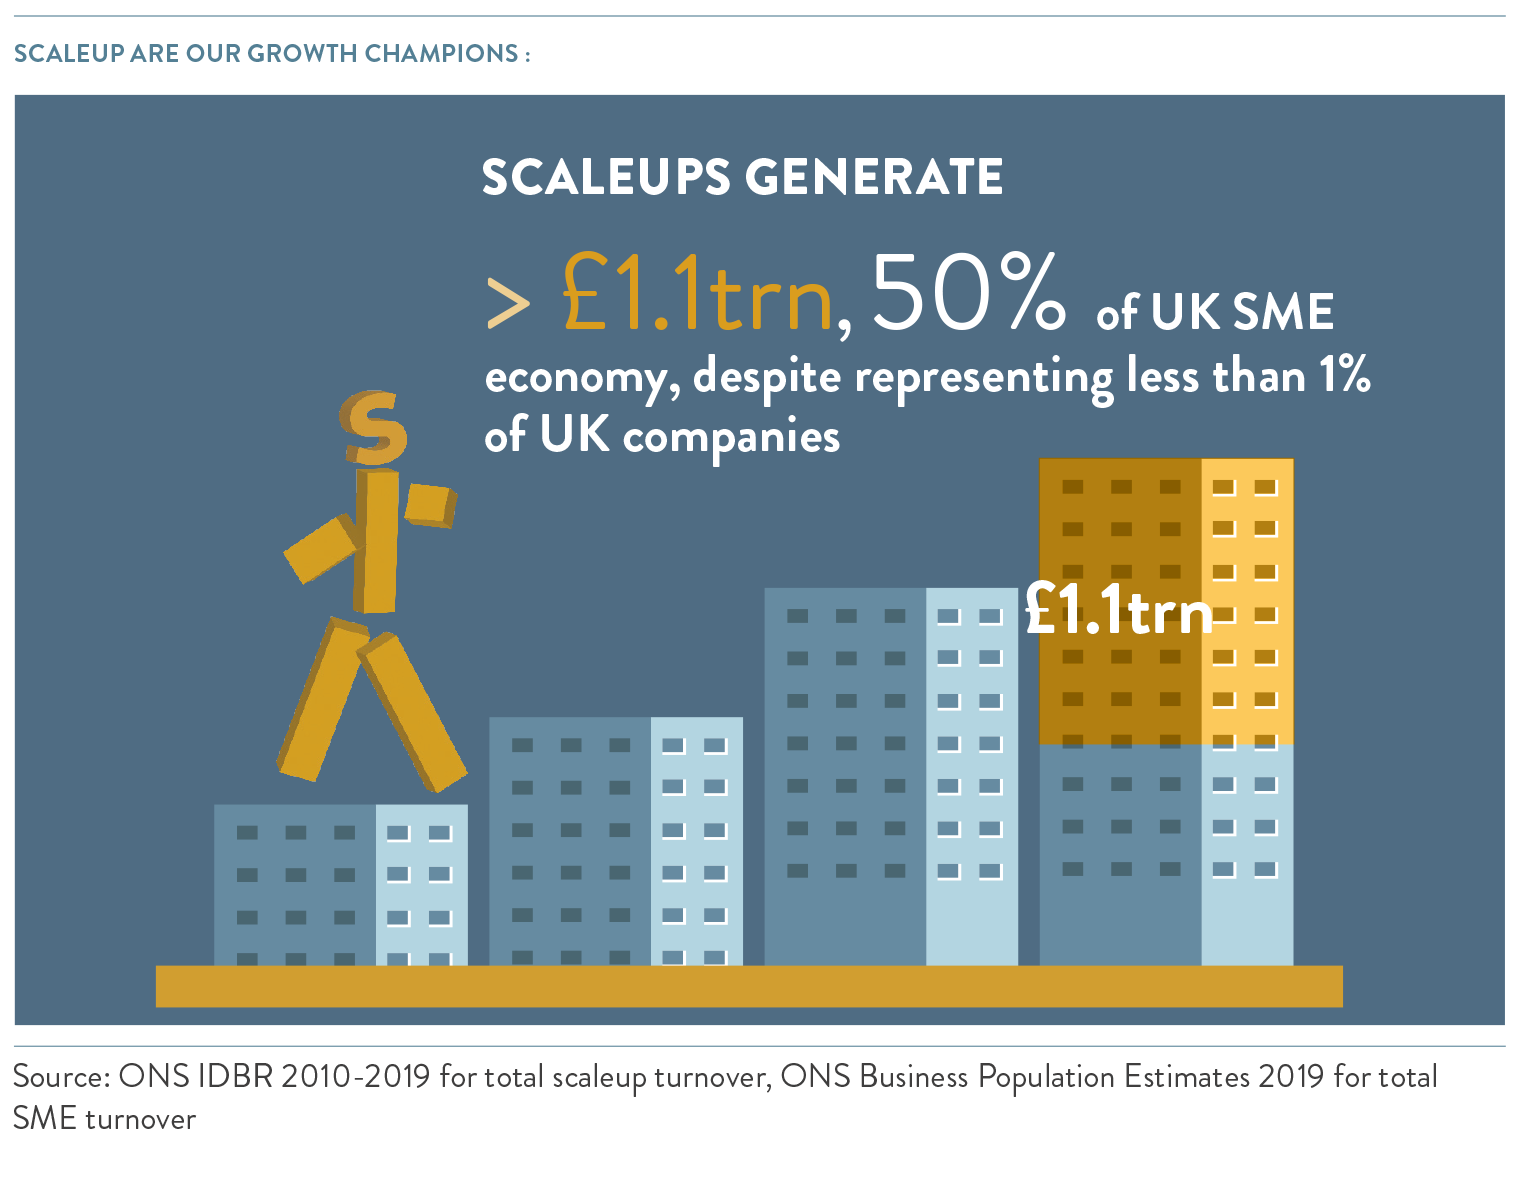
The value scaleups contribute to the UK economy remains substantial. In 2019, scaleups employed 3.2 million people and generated a total turnover of £1.1trn for the UK economy. The average turnover per scaleup was £32.6m with an average of 96 employees. The average turnover per employee was £338,000 – a 19% increase over 2018.
Scaleups continue to represent 50% of the total SME turnover output despite making up less than 0.6% of the SME population: this reinforces the critical need for segmentation and tailored policy, solutions and services for scaling firms in our public, private and education sectors.
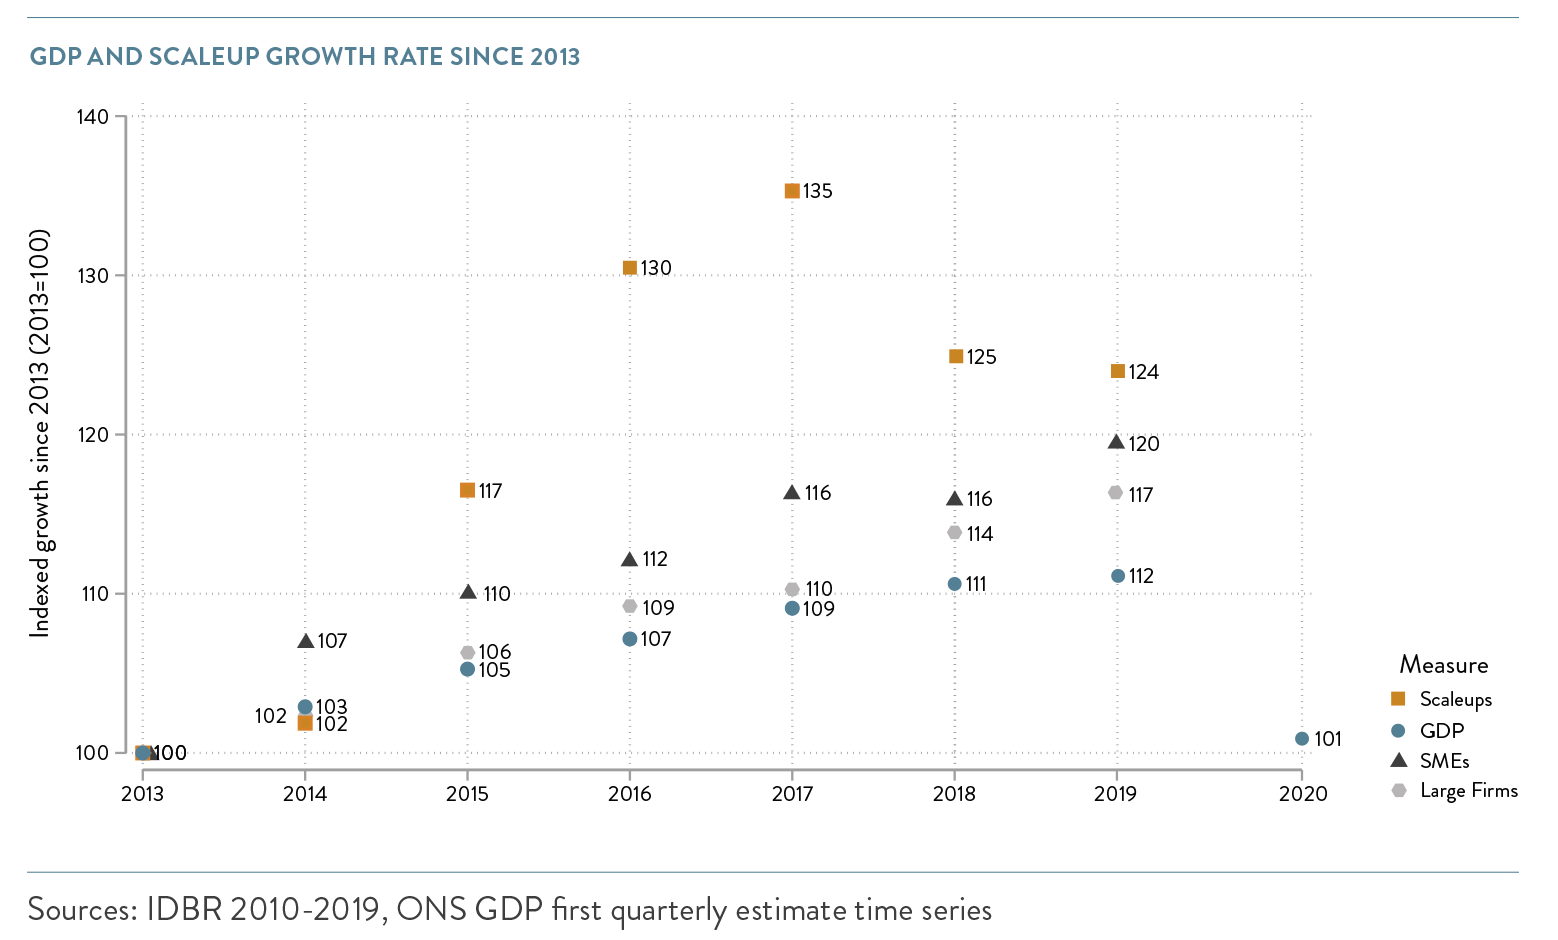
Scaleup growth has outstripped GDP growth over six years
Scaleup numbers are 24% above the 2013 total and in the period up to 2019 they have outperformed the economy and the broader universe of all SMEs. Over the same six-year period GDP has grown by 12% and the number of SMEs has grown by 20%. The chart below compares the growth in GDP and the growth in the number of scaleups with 2013 as the base year.
Scaleups span the breadth of the economy
Scaleups continue to be across all sectors of the economy.
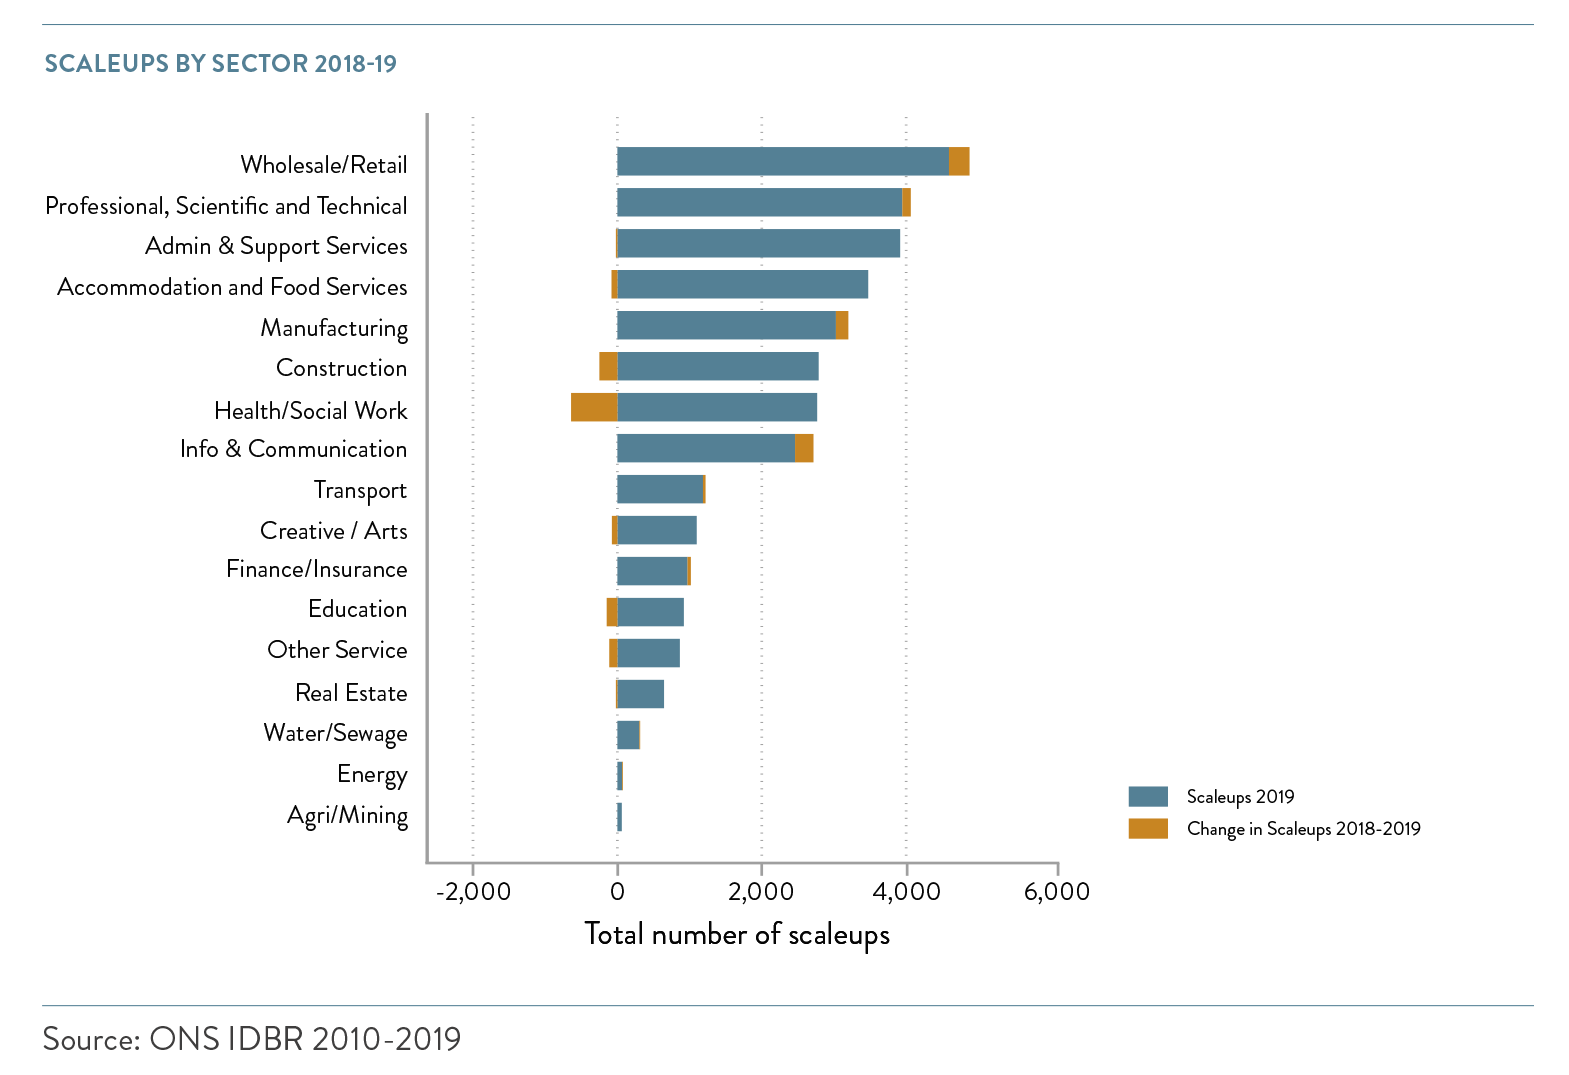
The ONS data shows that the largest four sectors by numbers of scaleups in 2018 remained the same in 2019. The sectors that made the biggest absolute gains in numbers of scaleups in 2019 were Wholesale/Retail and Information & Communications. Manufacturing saw the next largest increase in 2019, making it the fifth largest sector. However, there were slowdowns in Health/Social Work and Construction scaleups.
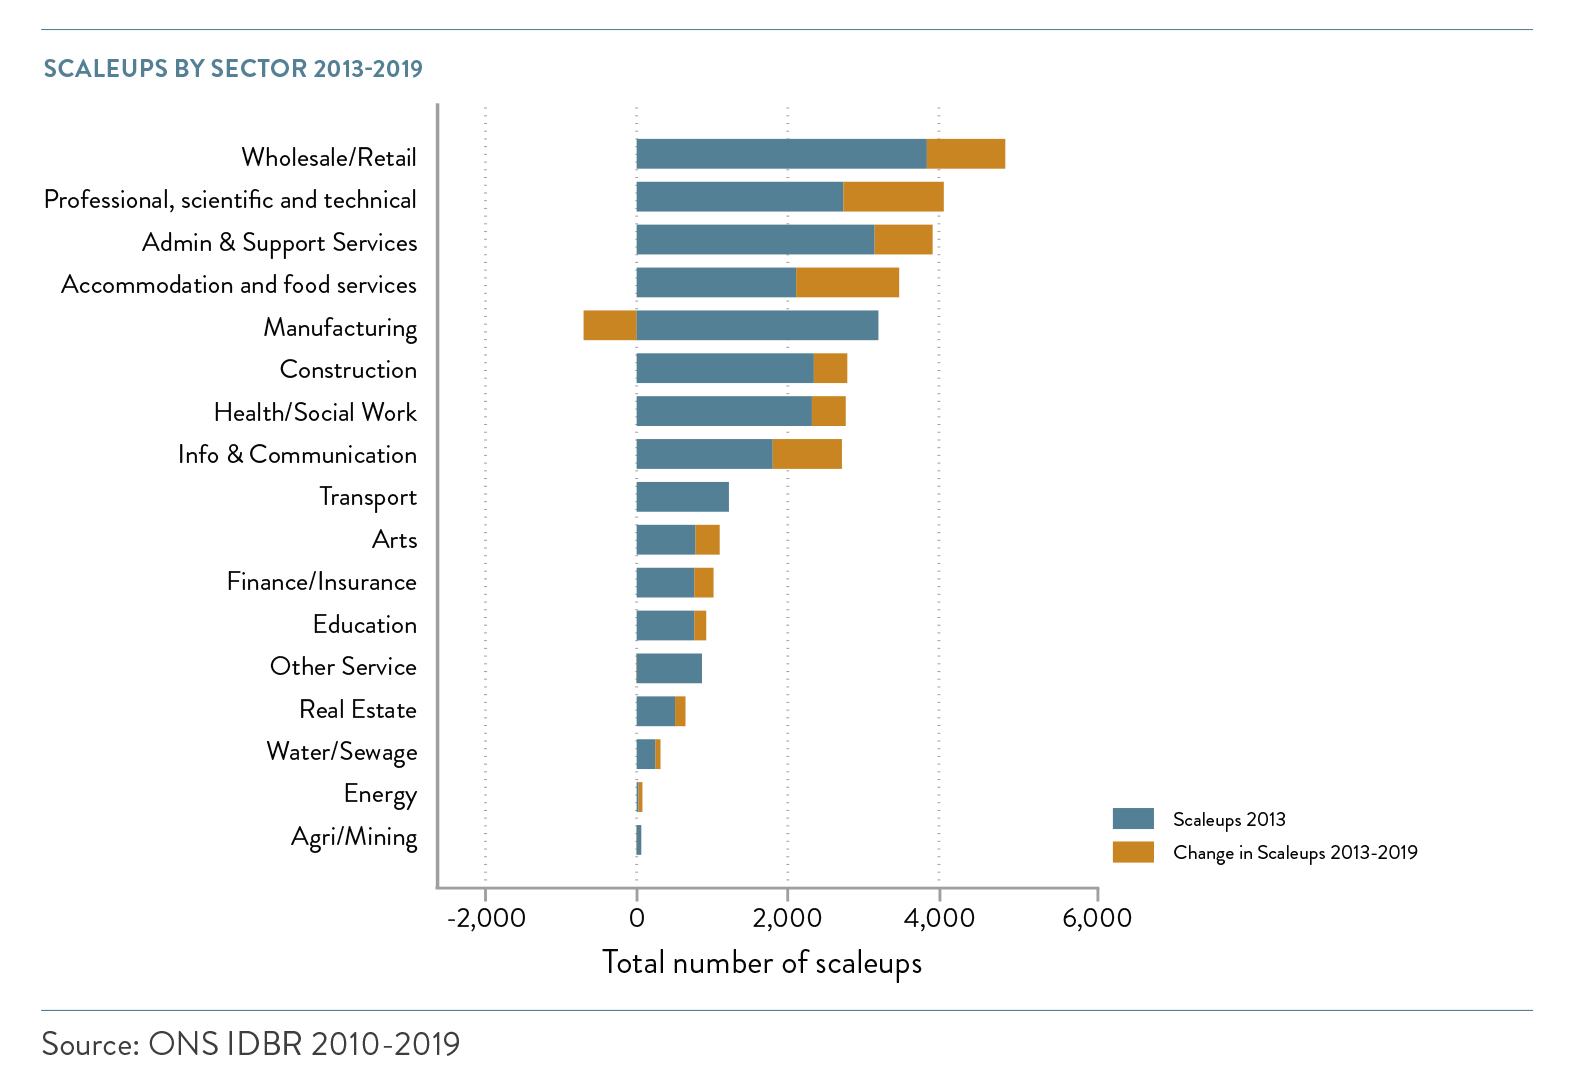
On a longitudinal basis looking at sectoral trends from 2013 to 2019, Accommodation and Food Services saw the largest absolute gain in numbers of scaleups, followed by Professional, Scientific & Technical, Wholesale/Retail, and Information & Communication. The Manufacturing sector saw the largest decline in scaleups over the total six year period – this is in line with wider trends in this sector – however the number of scaleups in this sector increased slightly between 2018 and 2019.
Scaleups: the productivity dynamos
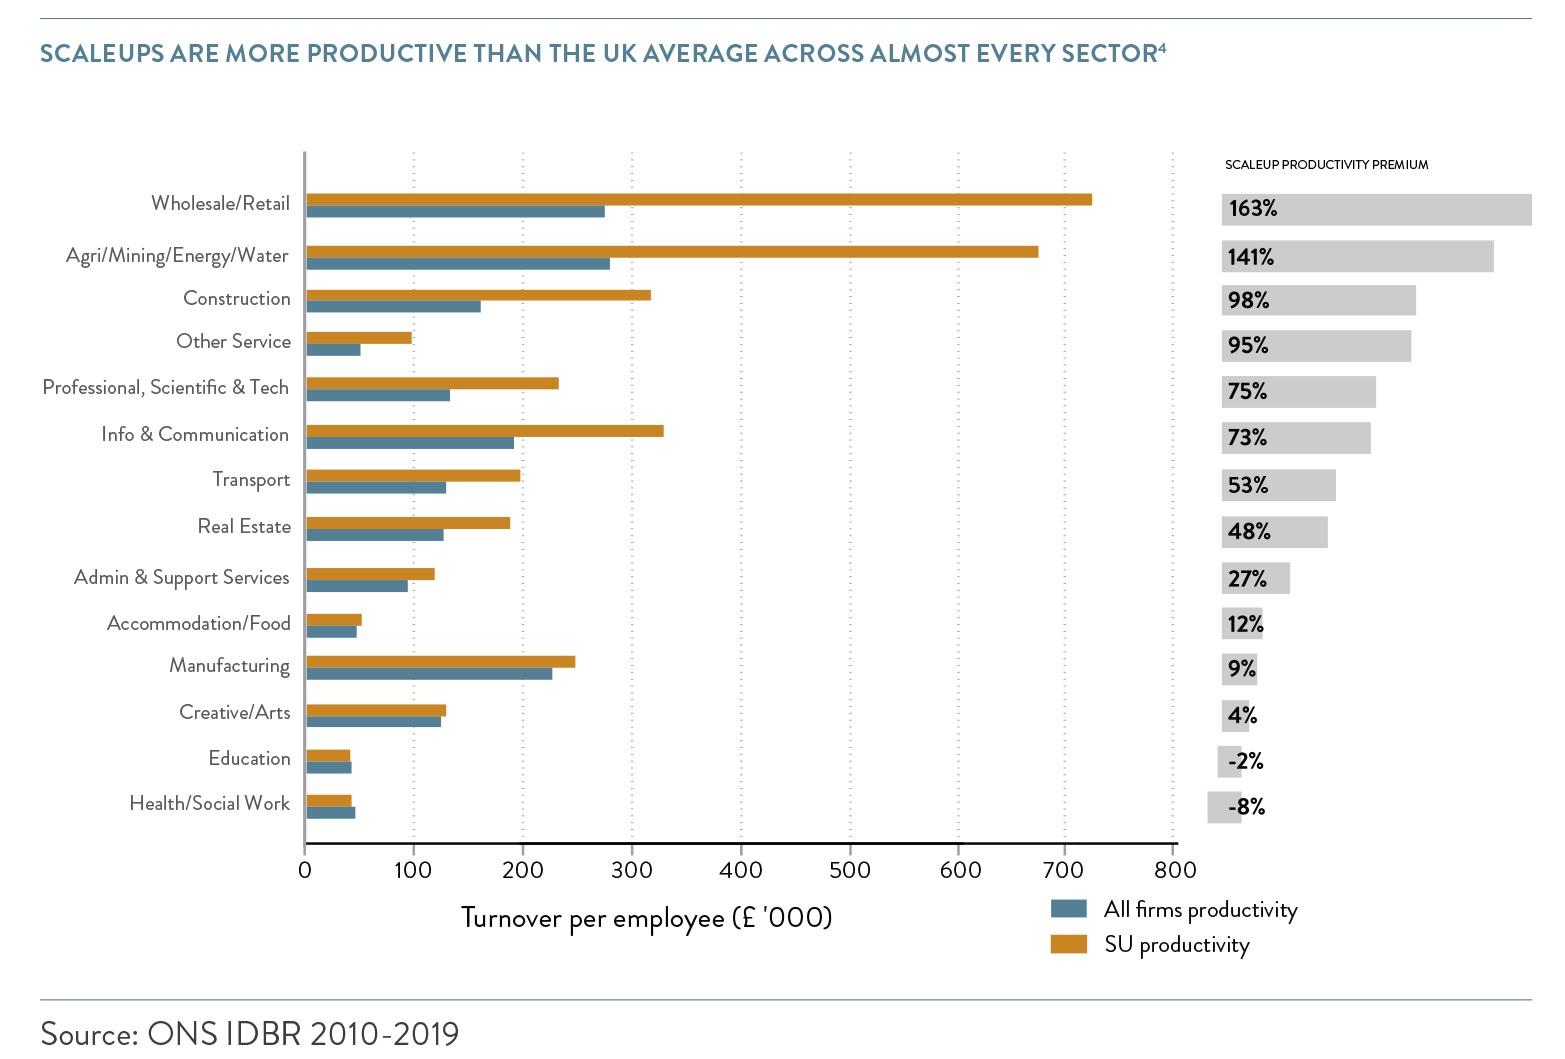
Scaleups continue to be more productive than other UK businesses across almost every sector of the economy. While the productivity premium of scaleups across all sectors was 51% compared to 54% in 2018, the top performing sectors did significantly better in 2019. The sectors in which scaleups demonstrated remarkable productivity outperformance were Wholesale/Retail; Agriculture/Mining/Energy/Water; Construction; and Other Services. They were 163%, 141%, 98%, and 95% more productive than their respective peers.
Sectoral clustering
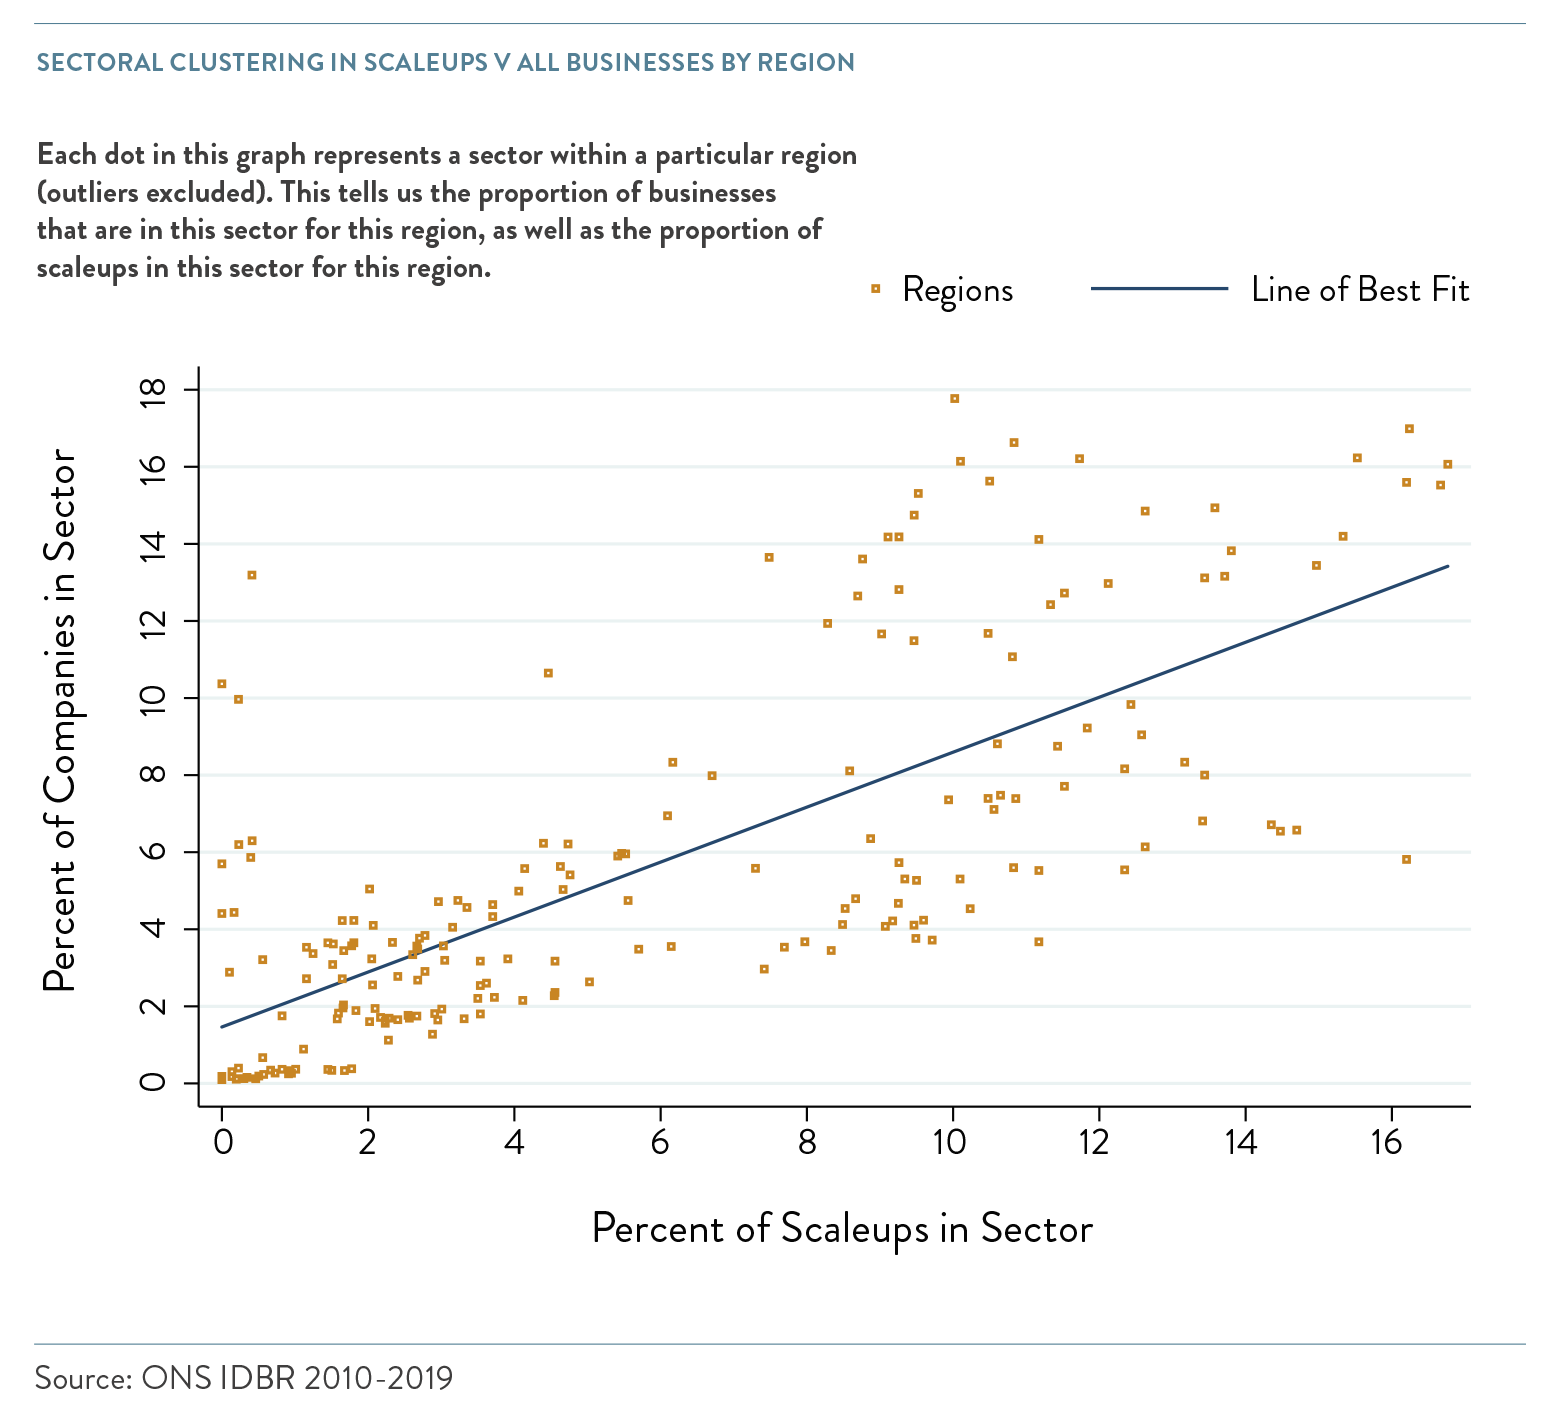
In 2020, we identified sectoral clustering as a driver of scaleup growth. This is because having a higher proportion of firms in the same sectors can increase the sharing of knowledge and resources, which are key to a thriving scaleup ecosystem.
There is a positive correlation between having a cluster of businesses in a sector and having a cluster of scaleups in that same sector. There is however variation between sectors. In 2019, Manufacturing; Health/Social Work; Accommodation and Food Services; and Admin & Support Services were significantly more likely to have sectoral clusters which scale.
Regional clustering
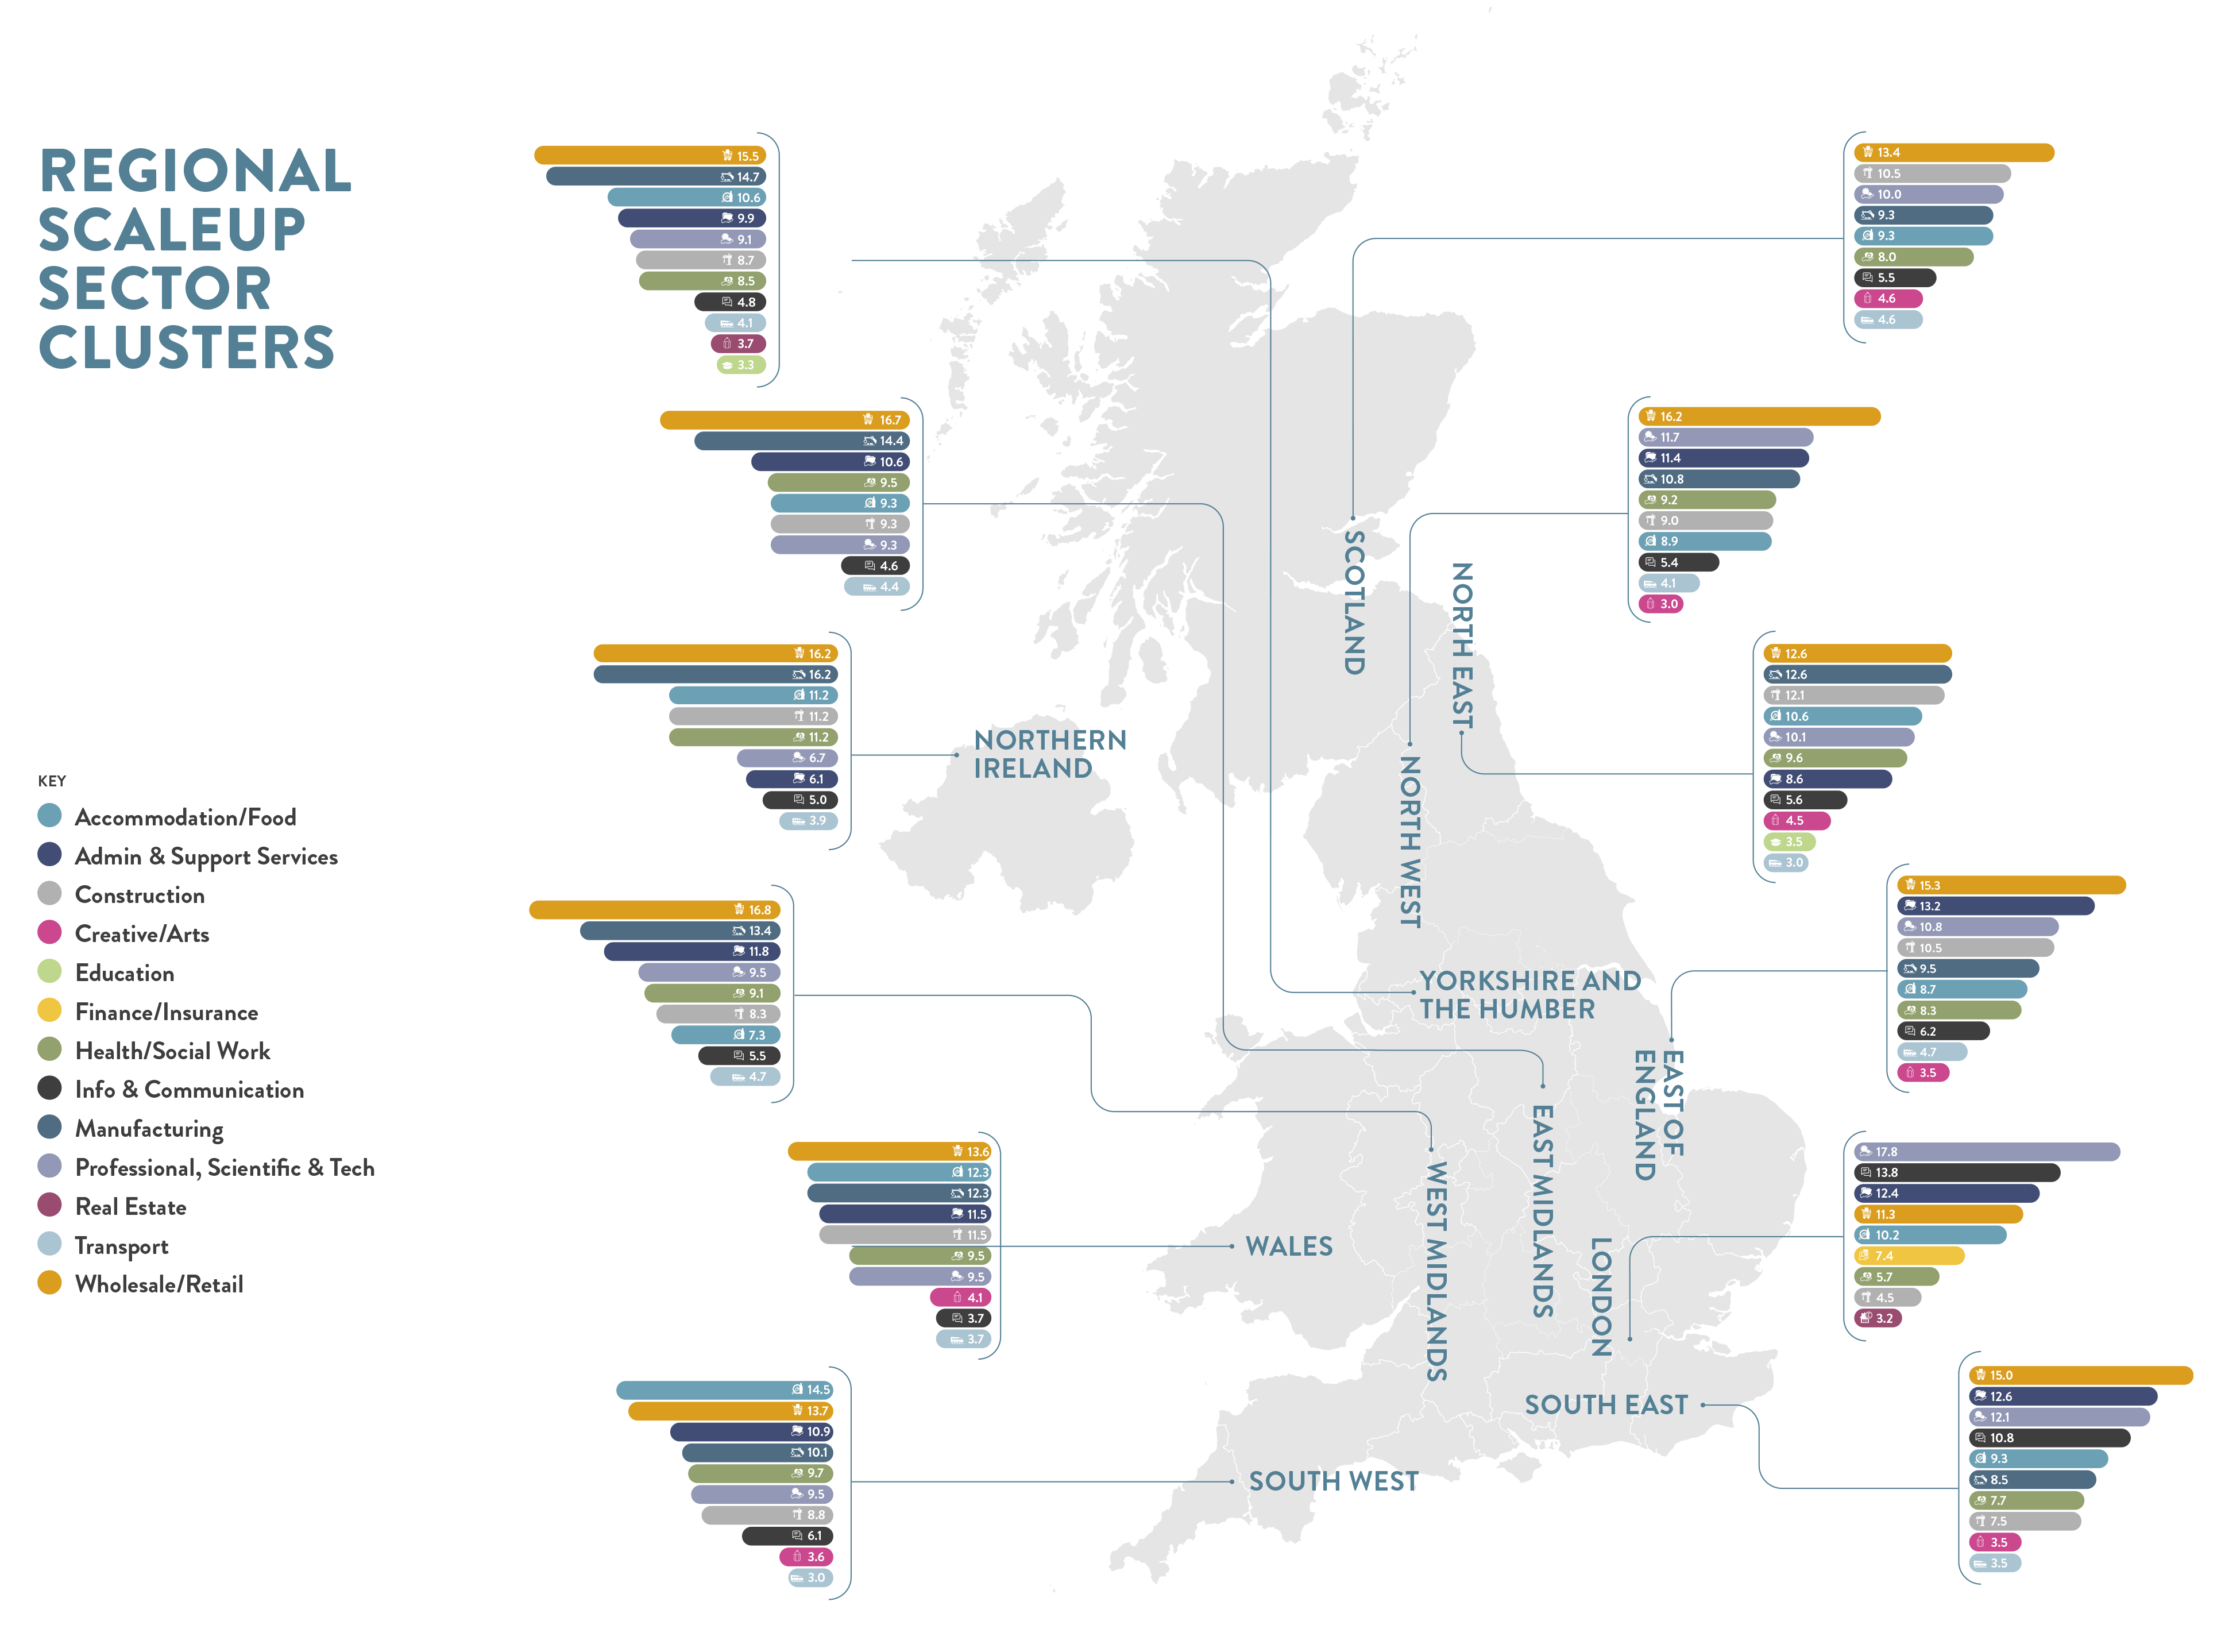
This year, for the first time, we are analysing the sectoral clustering of scaleups by region. This will help to inform local leaders on the sector clusters that are driving local scaleup growth. It will also assist in identifying potential vulnerabilities as sectors restructure during Covid.
The map below shows the sectors which represented at least 3% of the scaleups in each respective region in 2019.
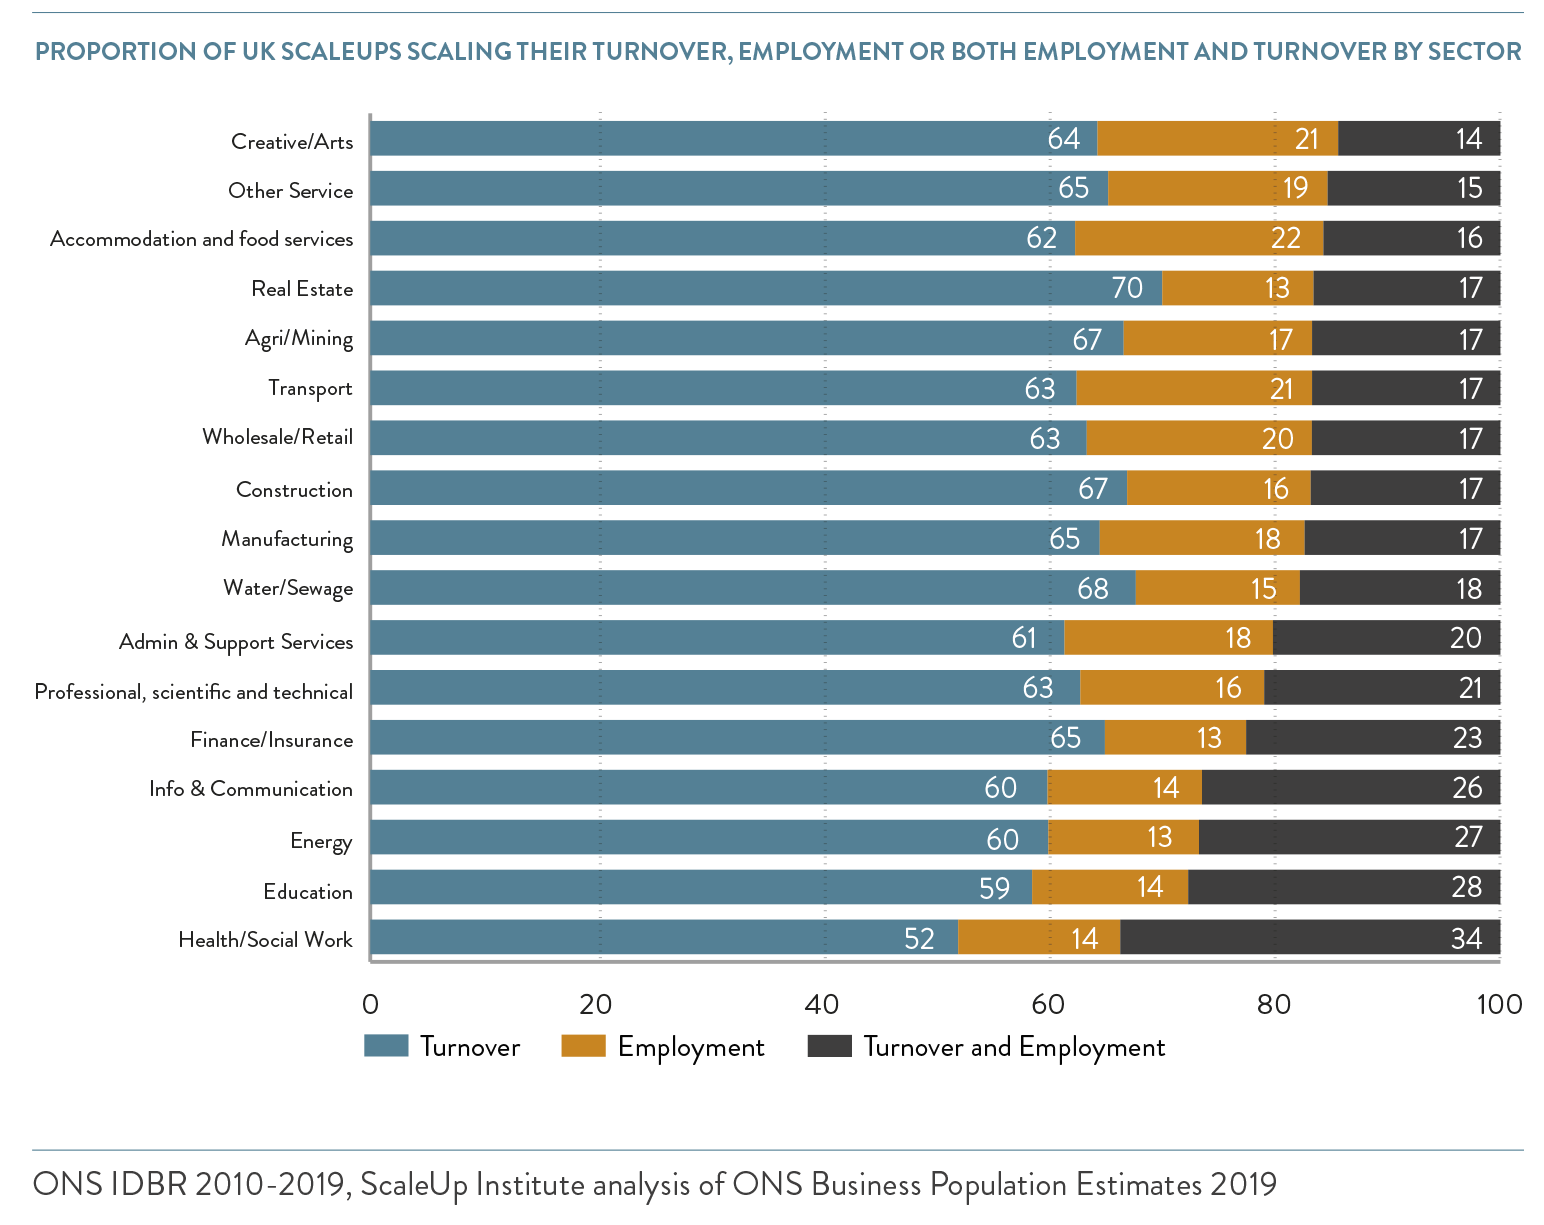
Scaleups: Patterns of turnover and employment growth
In 2019, businesses across sectors scaled in a similar way to those in 2018 – though the percentage of those scaling by turnover increased. Scaleups in Real Estate remained the most likely to scale by turnover exclusively (70%). Accommodation and Food Services (22%) and Creative/Arts (21%) were the most likely to scale exclusively by employment.
While Health/Social Work scaleups continued to be relative laggards when it came to productivity, they stood out here as the highest proportion of companies scaling by both turnover and employment (34%).
Regional analysis
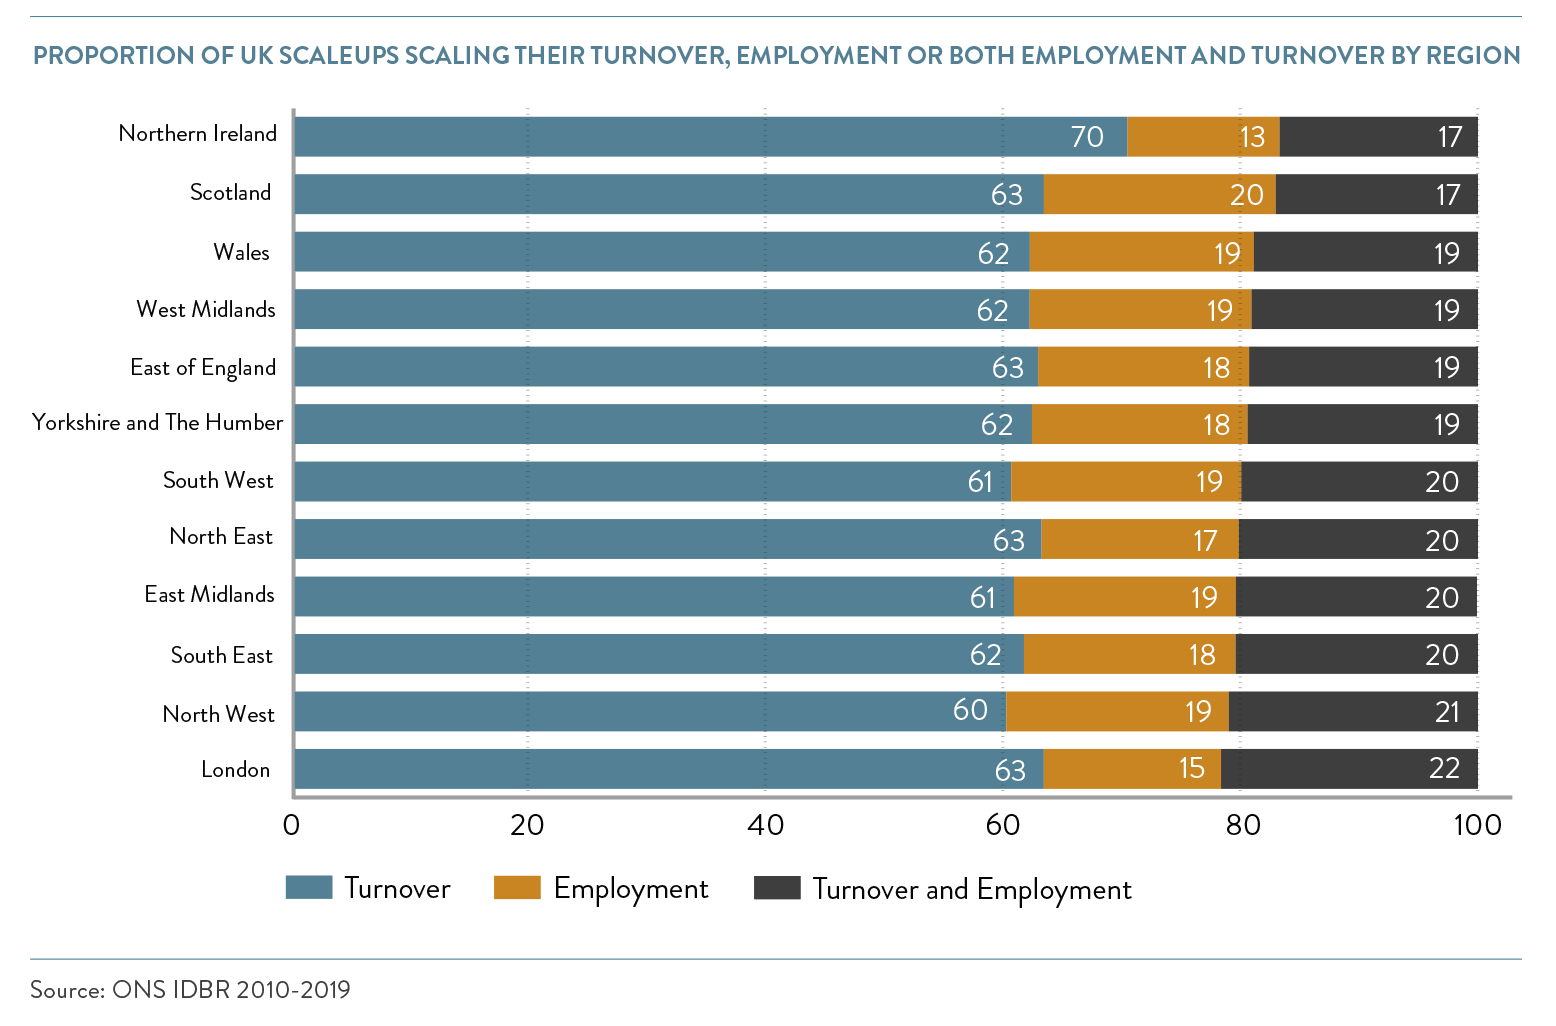
Regions varied on the proportion of businesses scaling by turnover or employment, owing to their different sectoral makeups.
- Northern Ireland had by far the highest proportion of turnover scaleups. This comes from sectors such as Construction and Wholesale/Retail accounting for a significant portion of the Northern Ireland scaleups.
- Scotland had the highest proportion of employment scaleups. Accommodation and Food Services and Wholesale/Retail scaleups accounted for much of this.
- London had the highest proportion of businesses scaling by both turnover and employment. This is partly due to it having a high proportion of Information & Communication scaleups – 27% of which in London scaled by both turnover and employment.
LOCAL ANALYSIS OF SCALEUP POPULATIONS AND GROWTH RATES
Levelling up must be a priority – local scaleup growth rates and trends
Analytical note: In 2021 the boundaries between 17 LEPs in England were adjusted to remove overlaps between areas that have existed since their formation. The analysis presented in this section reflects the new boundaries published by ONS in October 2021. This has resulted in some changes to absolute number and density of scaleups found in the affected LEPs and therefore in these cases local results are comparable with numbers published in previous Annual ScaleUp Reviews which are based on former LEP boundaries. Uk-wide scaleup numbers are unaffected by these changes.
Across the 38 LEPs and three devolved nations, we can now look at a six-year time horizon, since 2013, as well as the three-year rolling average.
This provides us with an insight into trends as well as a warning that in 2019 – despite scaleup growth in the majority of local areas across the 6 years – this growth has slowed down again in 2019 and needs careful attention.
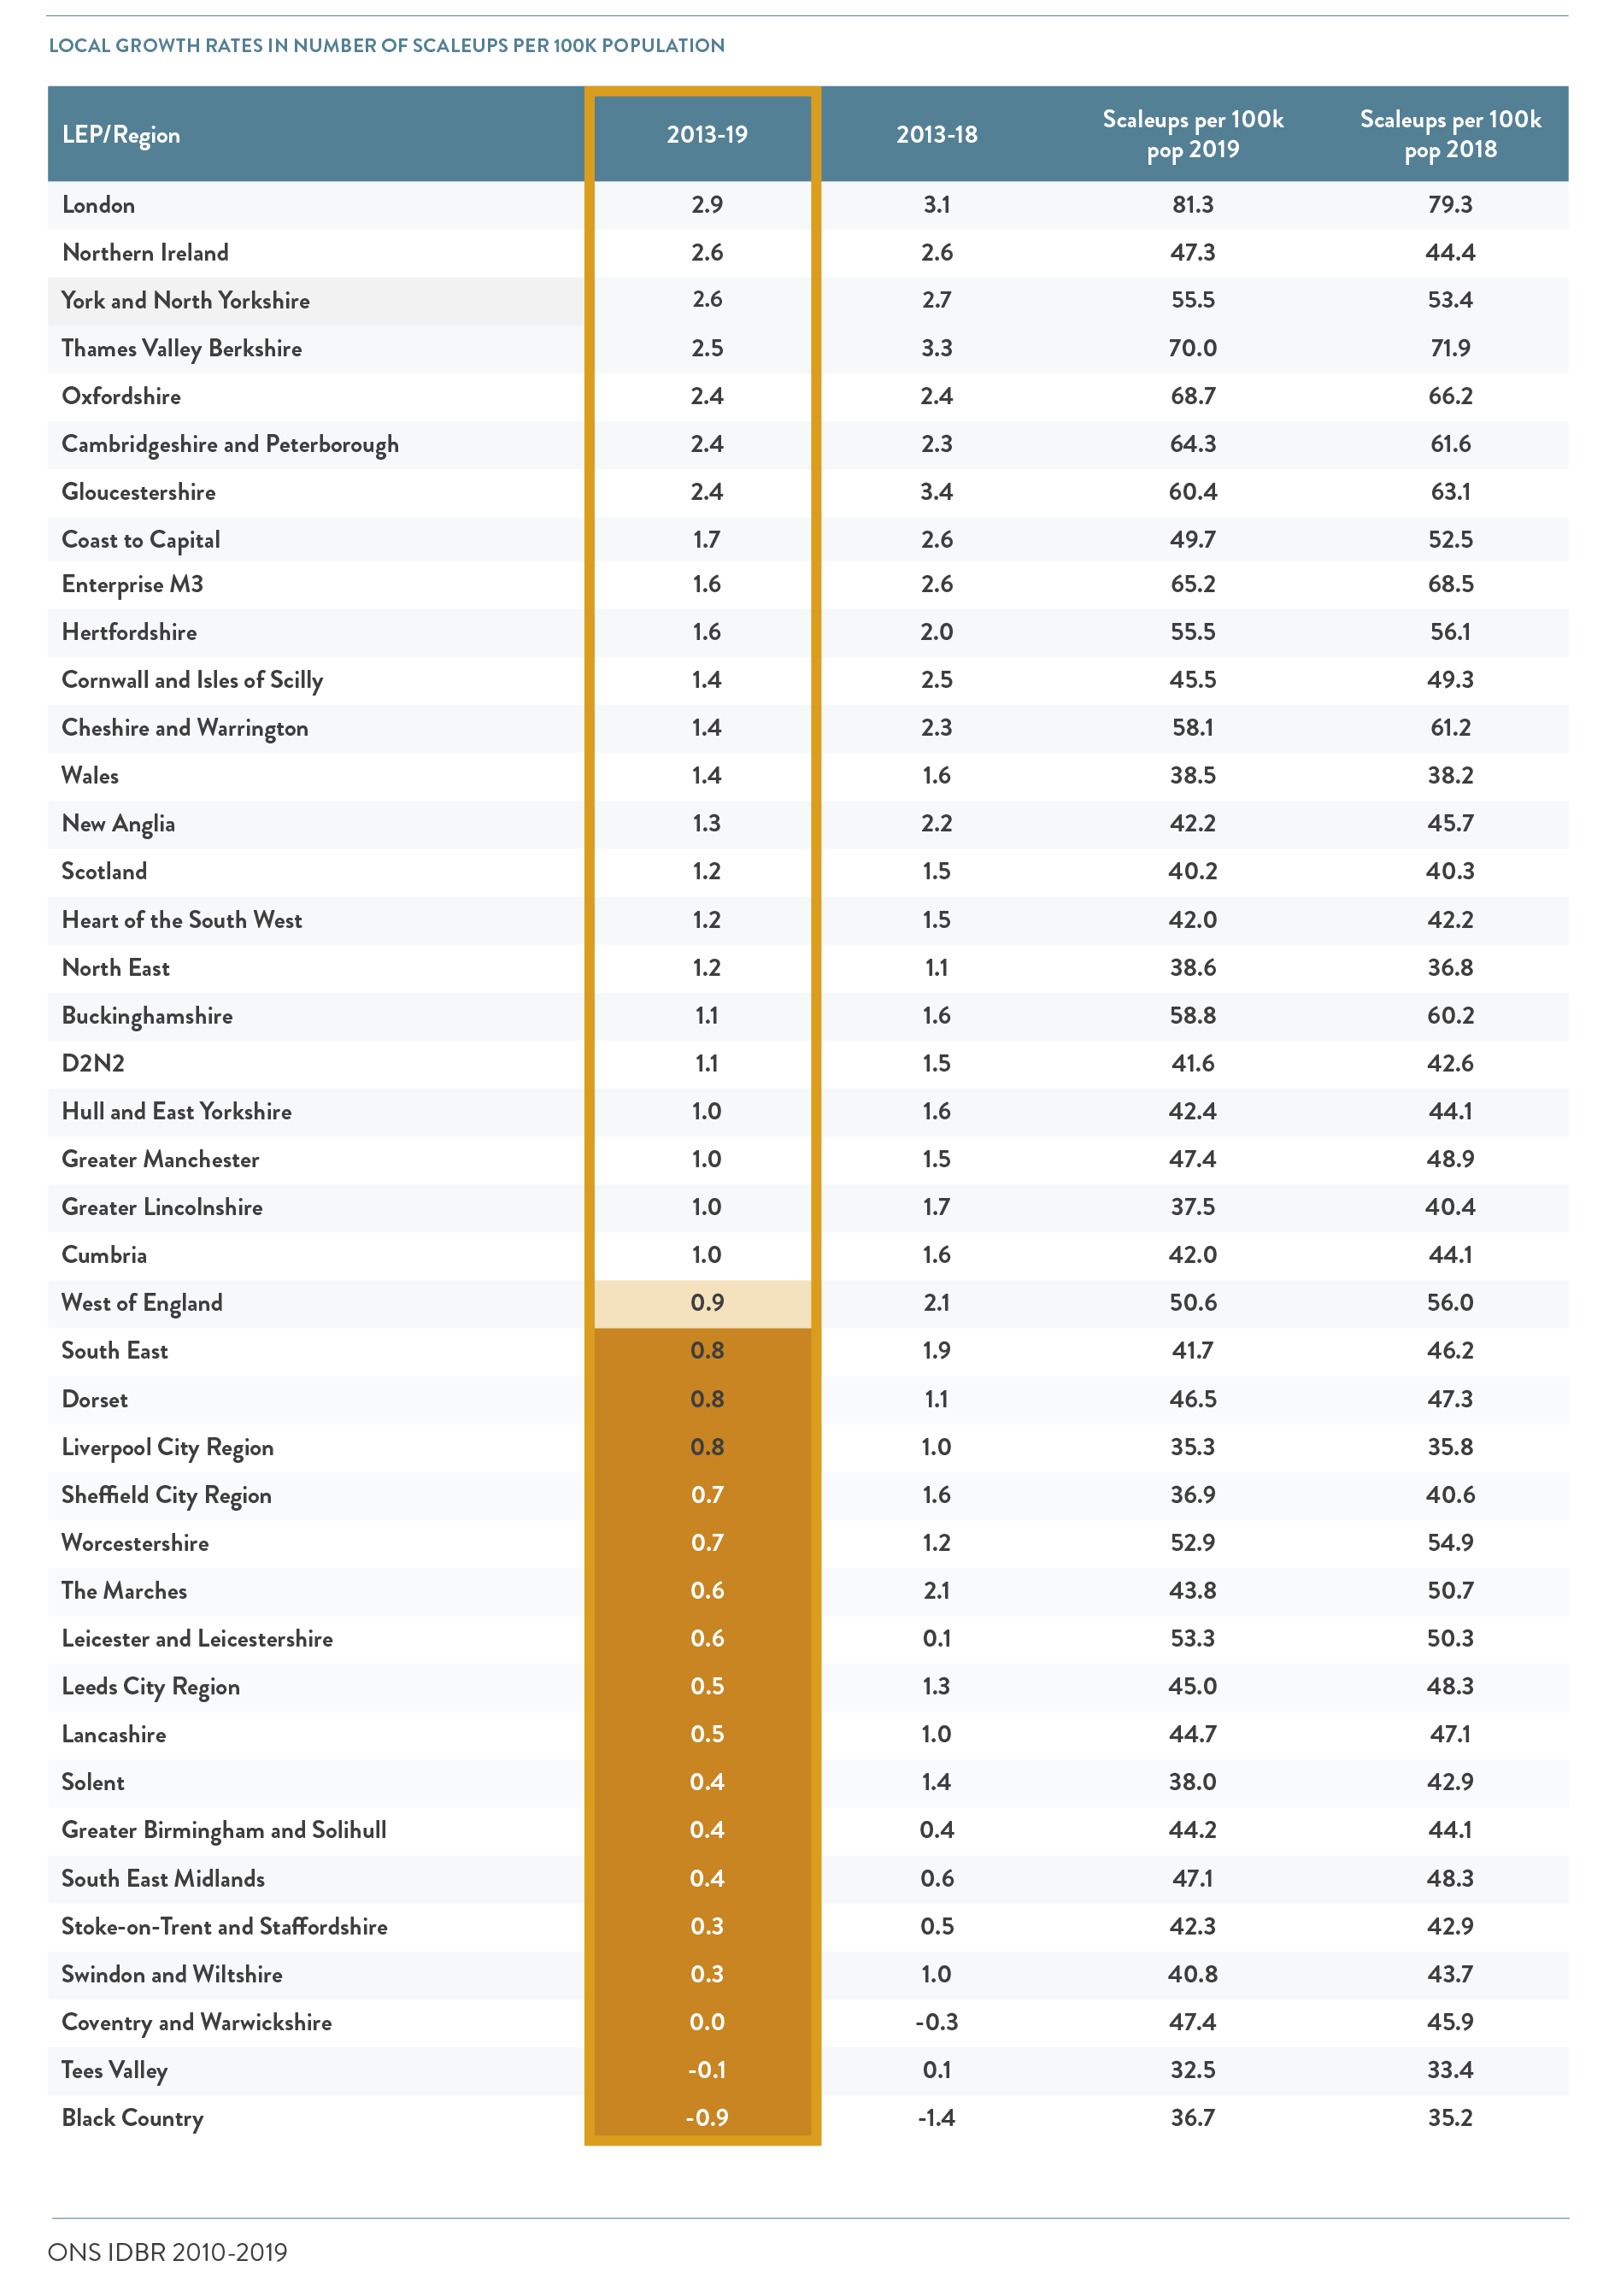
Over the six-year monitoring period since 2013 (outlined in orange on the table below) we observe:
- 39 of the 41 LEPs/devolved nations are growing in scaleups per 100,000 population.
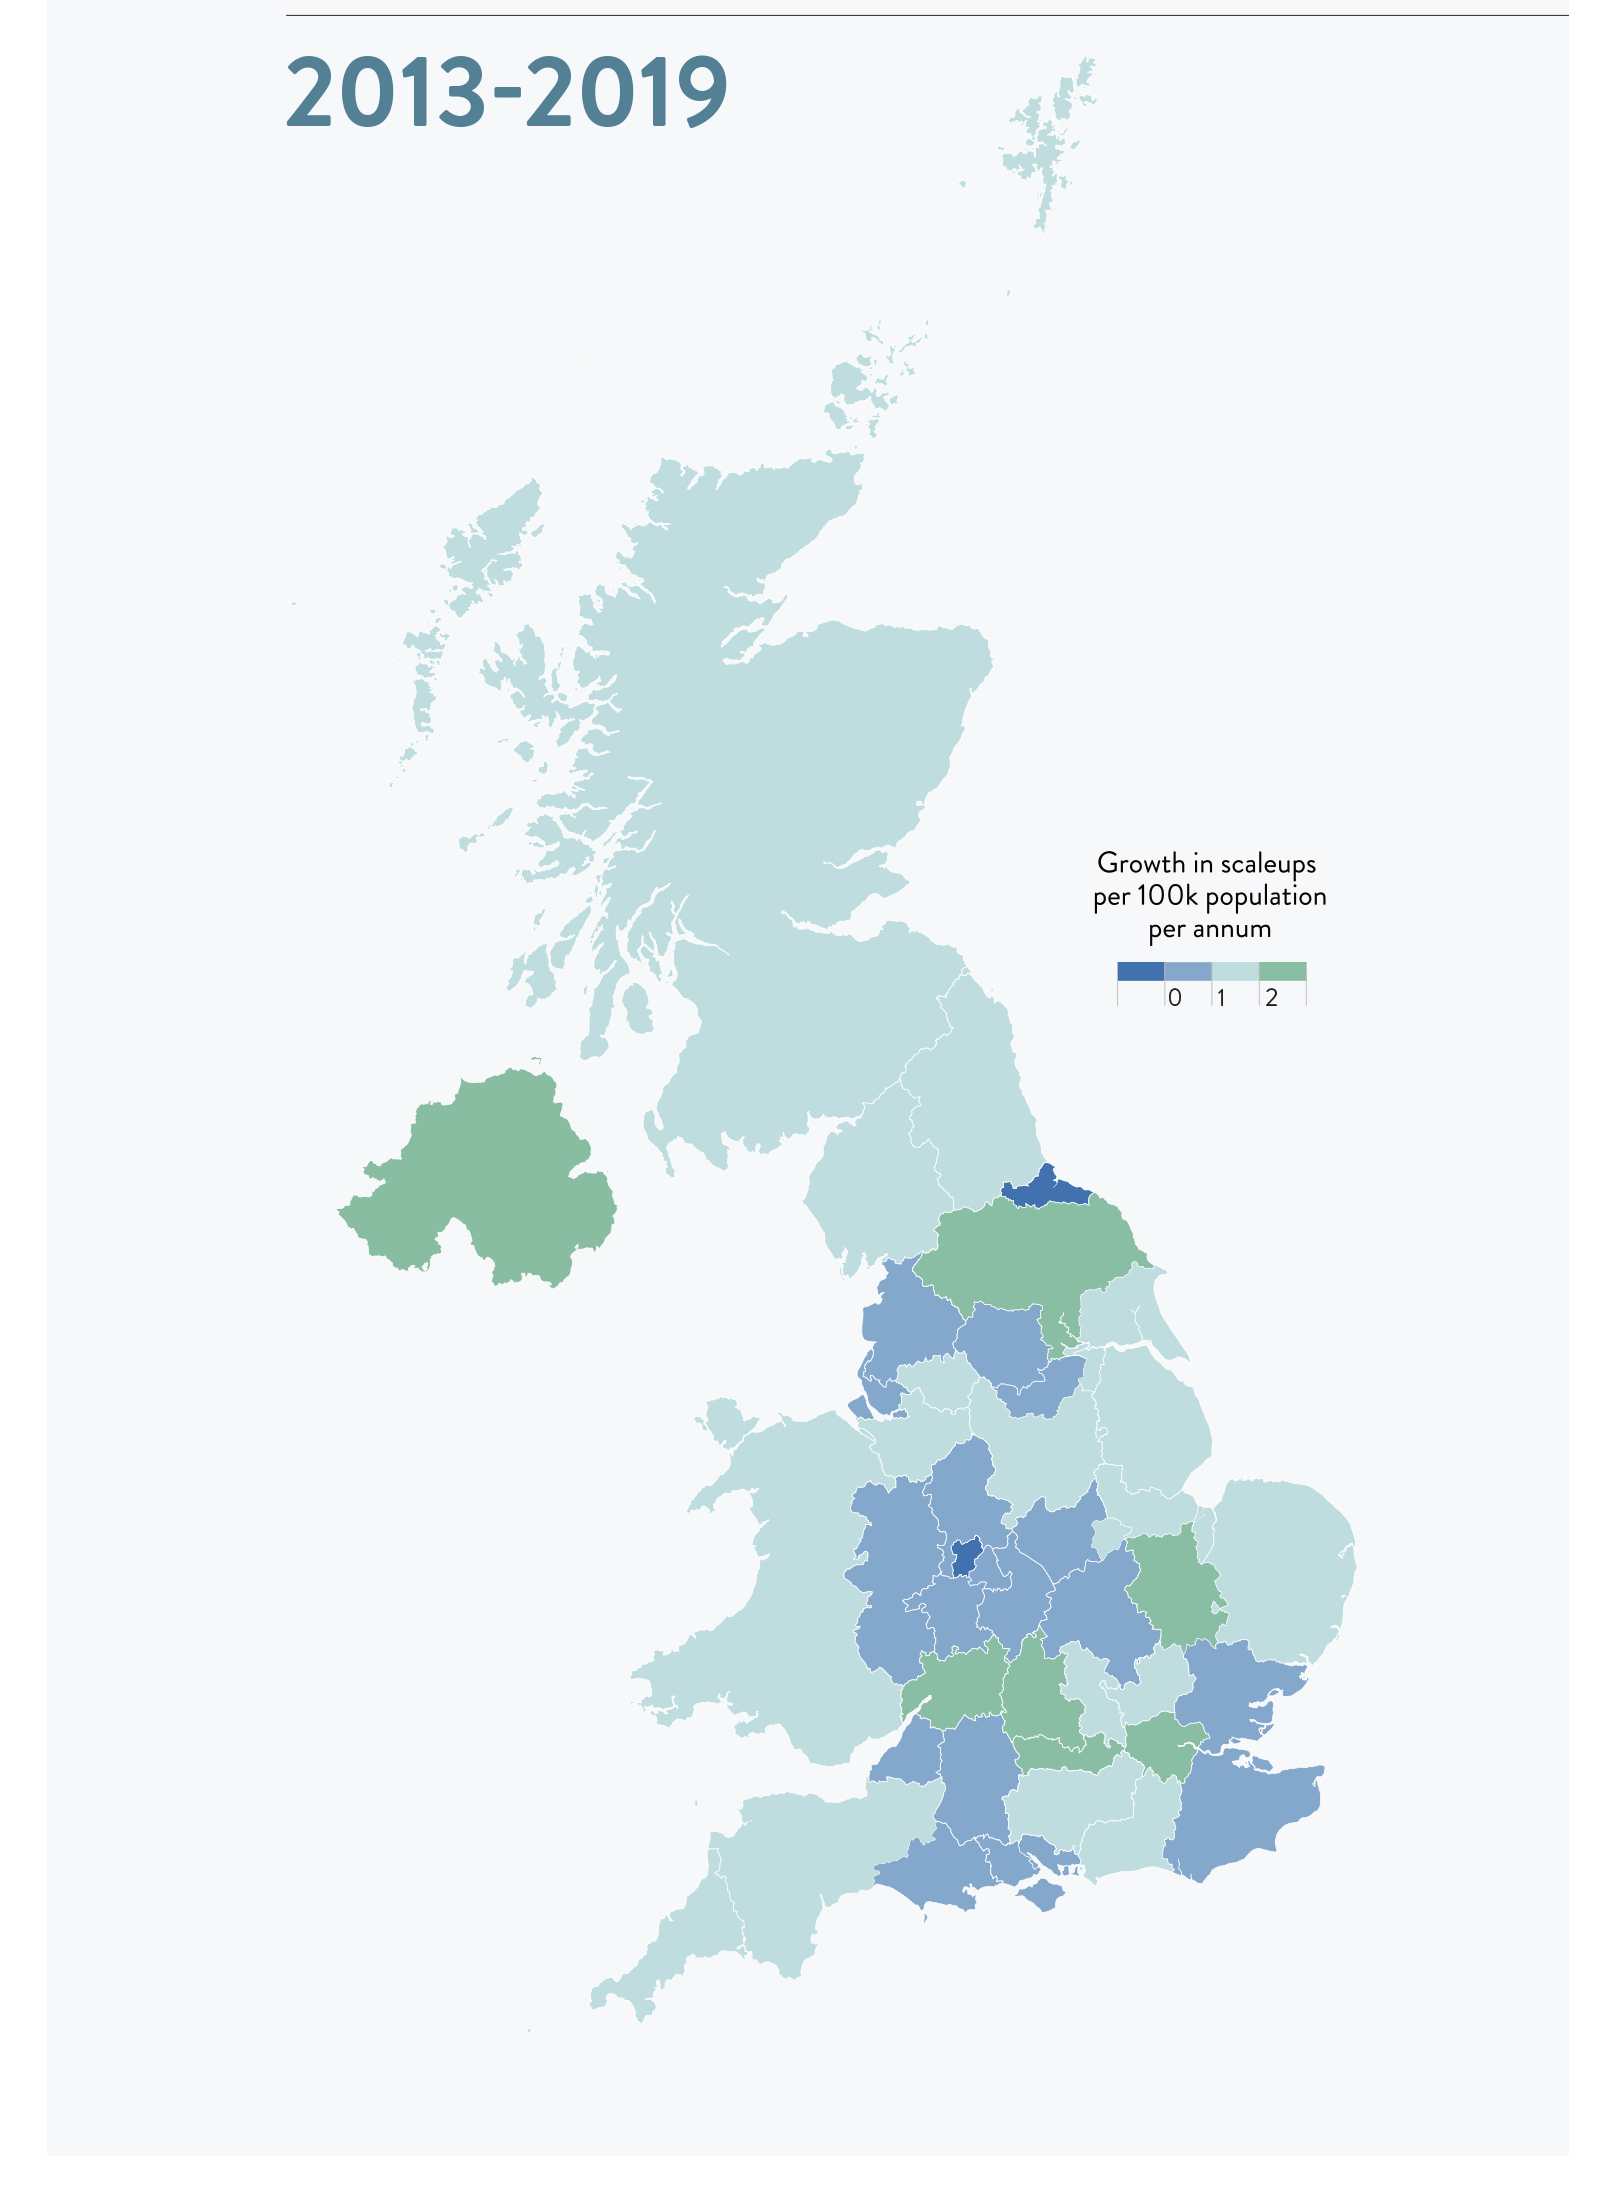
- With 7 areas where annual growth was greater than two additional scaleups per 100,000 population – London; Northern Ireland; York and North Yorkshire; Thames Valley Berkshire; Oxfordshire; Cambridgeshire and Peterborough; Gloucestershire.
- 8 of the top 10 Local Areas have remained consistent in 2018 and 2019.
- However in 2019 the scaleup growth rate is slowing down across the majority of the country. The ScaleUp Institute is monitoring this closely.
- In the 6 year trend (2013-2019) 17 areas (highlighted in darker orange) are now well below a rate of 1 additional scaleup per 100,000 population and West of England, one of our normally strong growth areas, is verging towards a below 1 trend (highlighted in light orange on the table below).
- In the period from 2016 to 2019, only Thames Valley Berkshire, Cambridgeshire and Peterborough, Oxfordshire, and London grew their scaleup density. These were also areas which have seen particularly strong scaleup growth since 2013.
Local patterns of scaleups
The median growth of scaleups for the rolling 3 year period decreased from 0.8 to -1.4, while the median scaleups per 100k decreased from 47.3 to 45.0.
Local patterns of turnover and employment scaleups
The top 5 LEPs/devolved nations for growth in turnover scaleups were Thames Valley Berkshire, Oxfordshire, London, Greater Cambridge and Greater Peterborough and Dorset. The top 5 LEPs/devolved nations for scaleup density in turnover scaleups were London, Thames Valley Berkshire, Oxfordshire, Enterprise M3, and Cambridgeshire and Peterborough.
The LEPs/devolved nations with the 5 highest growth rates in employment scaleups for 2016-2019 were Worcestershire, Hull and East Yorkshire, Oxfordshire, Greater Birmingham and Solihull, and Liverpool City Region. When looking at scaleup density in employment scaleups, the top 5 LEPs/devolved were London, Oxfordshire, Thames Valley Berkshire, Enterprise M3, and Cambridgeshire and Peterborough.
Longer term growth trends in scaleups at a LEP/devolved nation level are illustrated in the maps below. Areas of a brighter green exhibiting higher growth and areas of blue showing slower growth or decline in scaleup populations.
Of the top 10 LEPs/devolved nations that grew at the highest rates from 2013 to 2019, 8 had the highest scaleup density in 2019.
Local authority picture
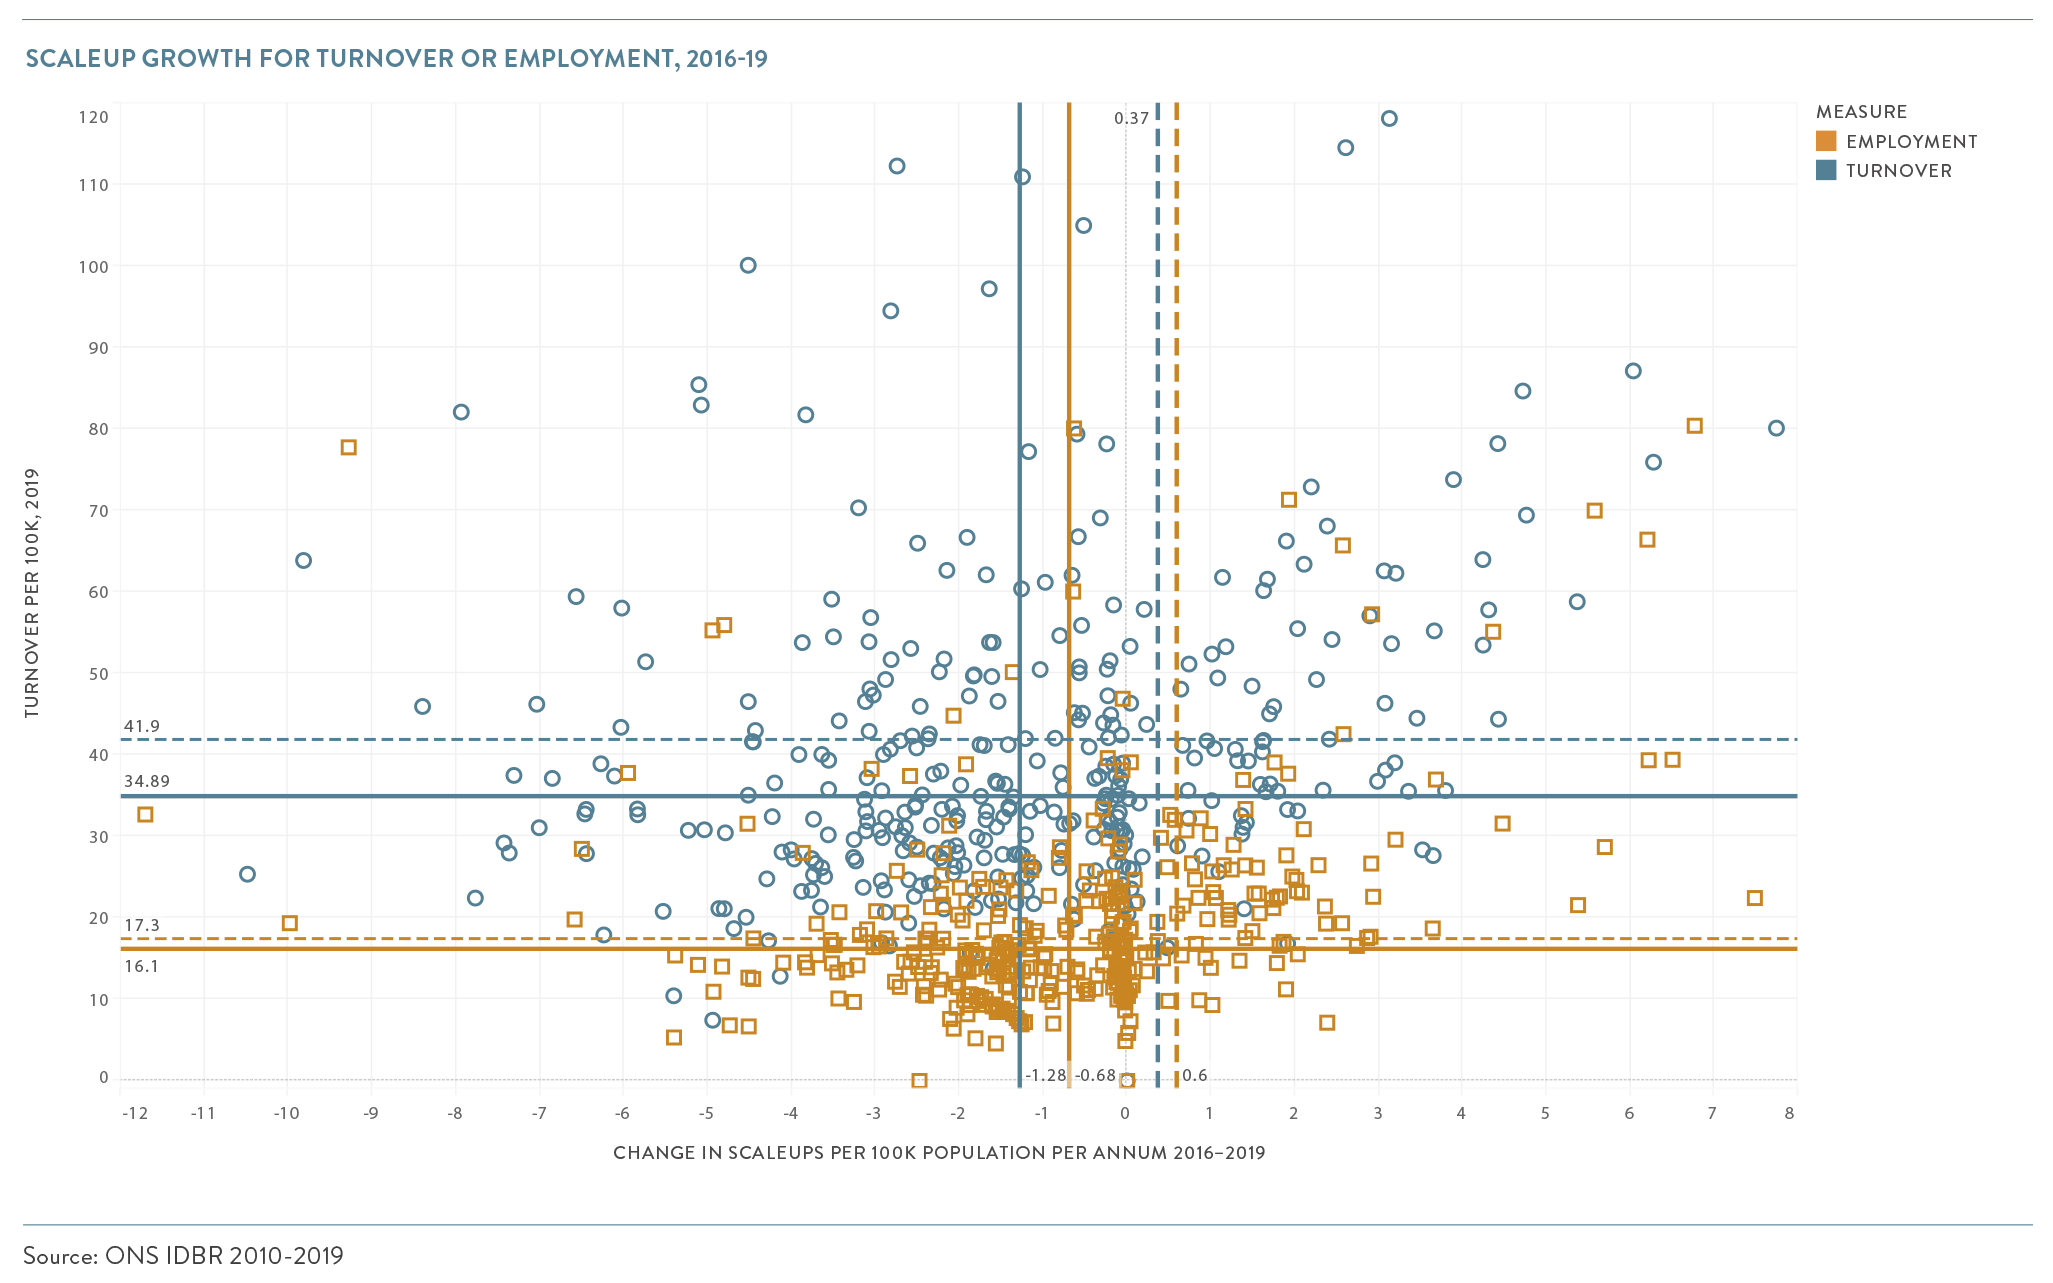
The number of scaleups per 100,000 of population varied widely among local authorities. The figure below plots the number of employment and turnover scaleups by local authority against the growth rate.
For employment scaleups, the median growth rate decreased from 0.6 to -0.7, and the median density decreased from 17.3 to 16.1. For turnover scaleups, the median growth rate decreased from 0.4 to -1.3, and the median density decreased from 41.9 to 34.9.
CONTENTS

Introduction 2021

Chapter 1 2021
The ScaleUp Business Landscape

Chapter 2 2021
Leading Programmes Breaking Down the Barriers for Scaleups

Chapter 3 2021
The Local Scaleup Ecosystem

Chapter 4 2021
The Policy Landscape

Chapter 5 2021
Looking forward

Annexes 2021

Scaleup Stories 2021

 Previous

Share