Explore the ScaleUp Annual Review 2021
Select a section to expand and explore this year's review.
CONTENTS
Introduction 2021
Chapter 1 2021
The ScaleUp Business Landscape
Chapter 2 2021
Leading Programmes Breaking Down the Barriers for Scaleups
Chapter 3 2021
The Local Scaleup Ecosystem
Chapter 4 2021
The Policy Landscape
Chapter 5 2021
Looking forward
Annexes 2021
Scaleup Stories 2021
The scaling pipeline
The “scaling pipeline” are those businesses that are not yet at scaleup growth rates but are growing turnover or employment at 15-19.99% annually between 2016-2019. For the first time, we can now observe the scaling pipeline for the entire period in which we have monitored scaleups.
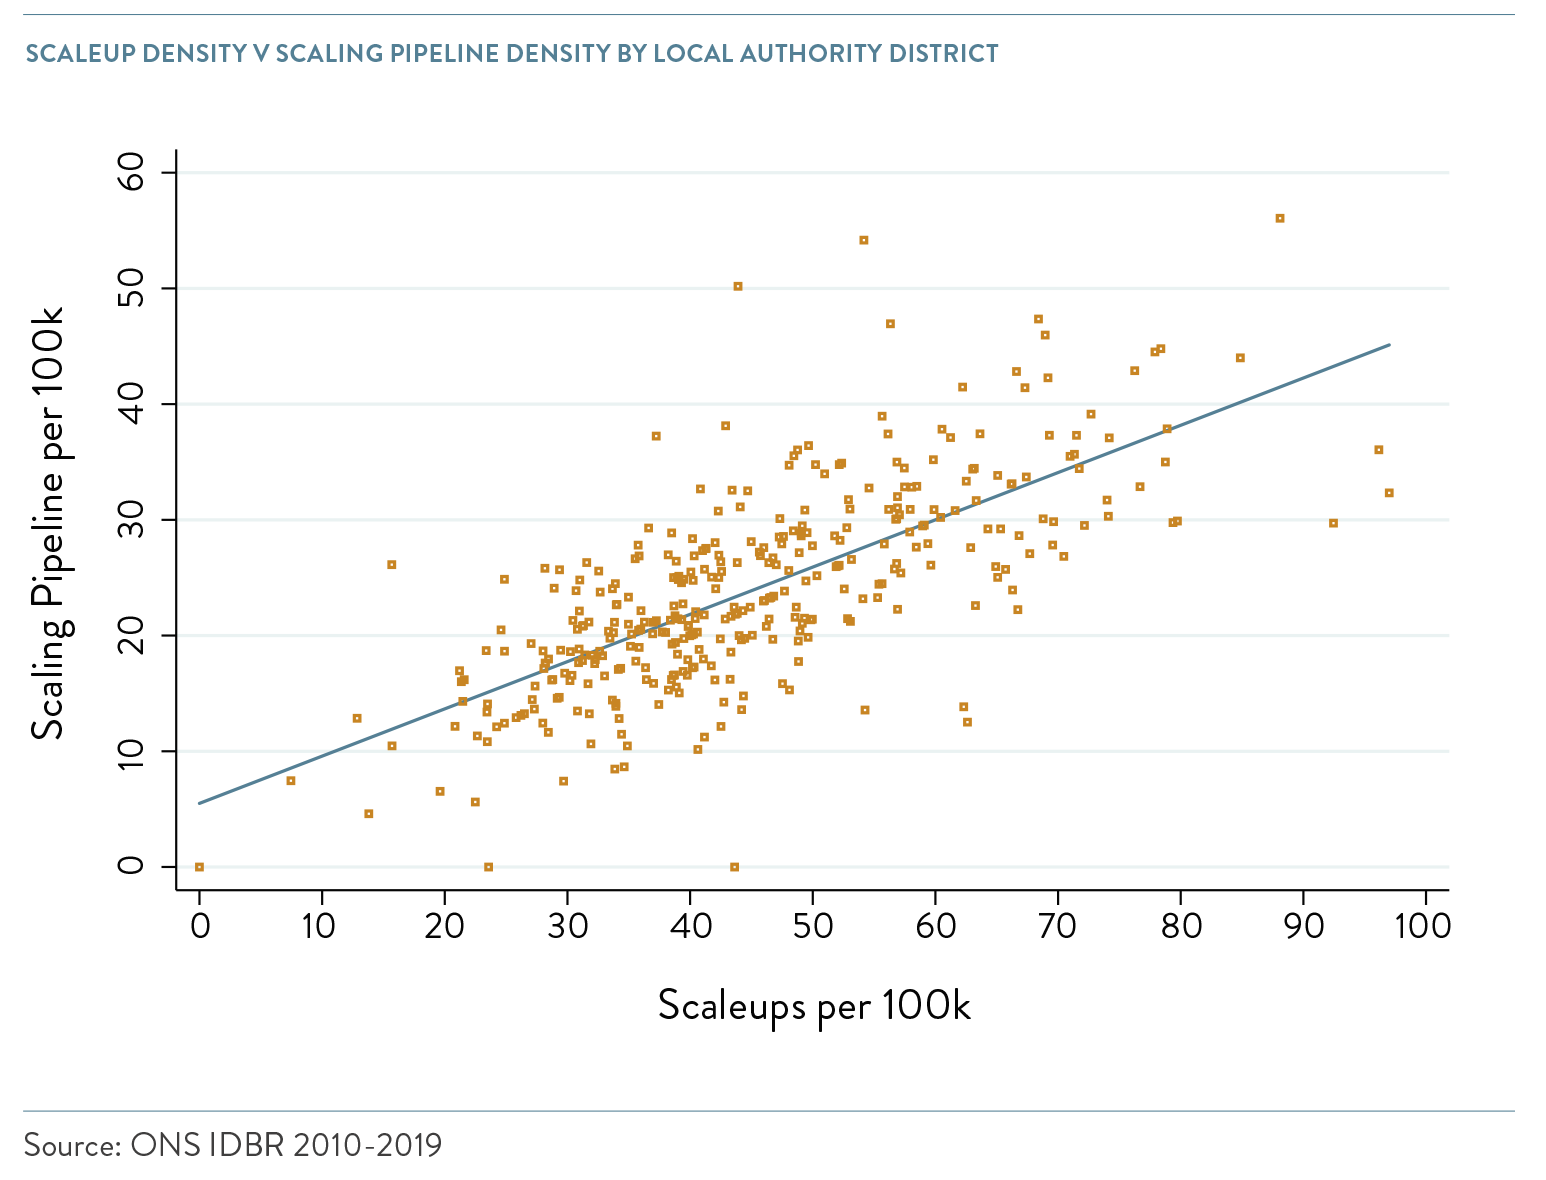
There is a strong positive relationship between a local area having a strong scaling pipeline and a strong scaleup population. The graph below plots this relationship.
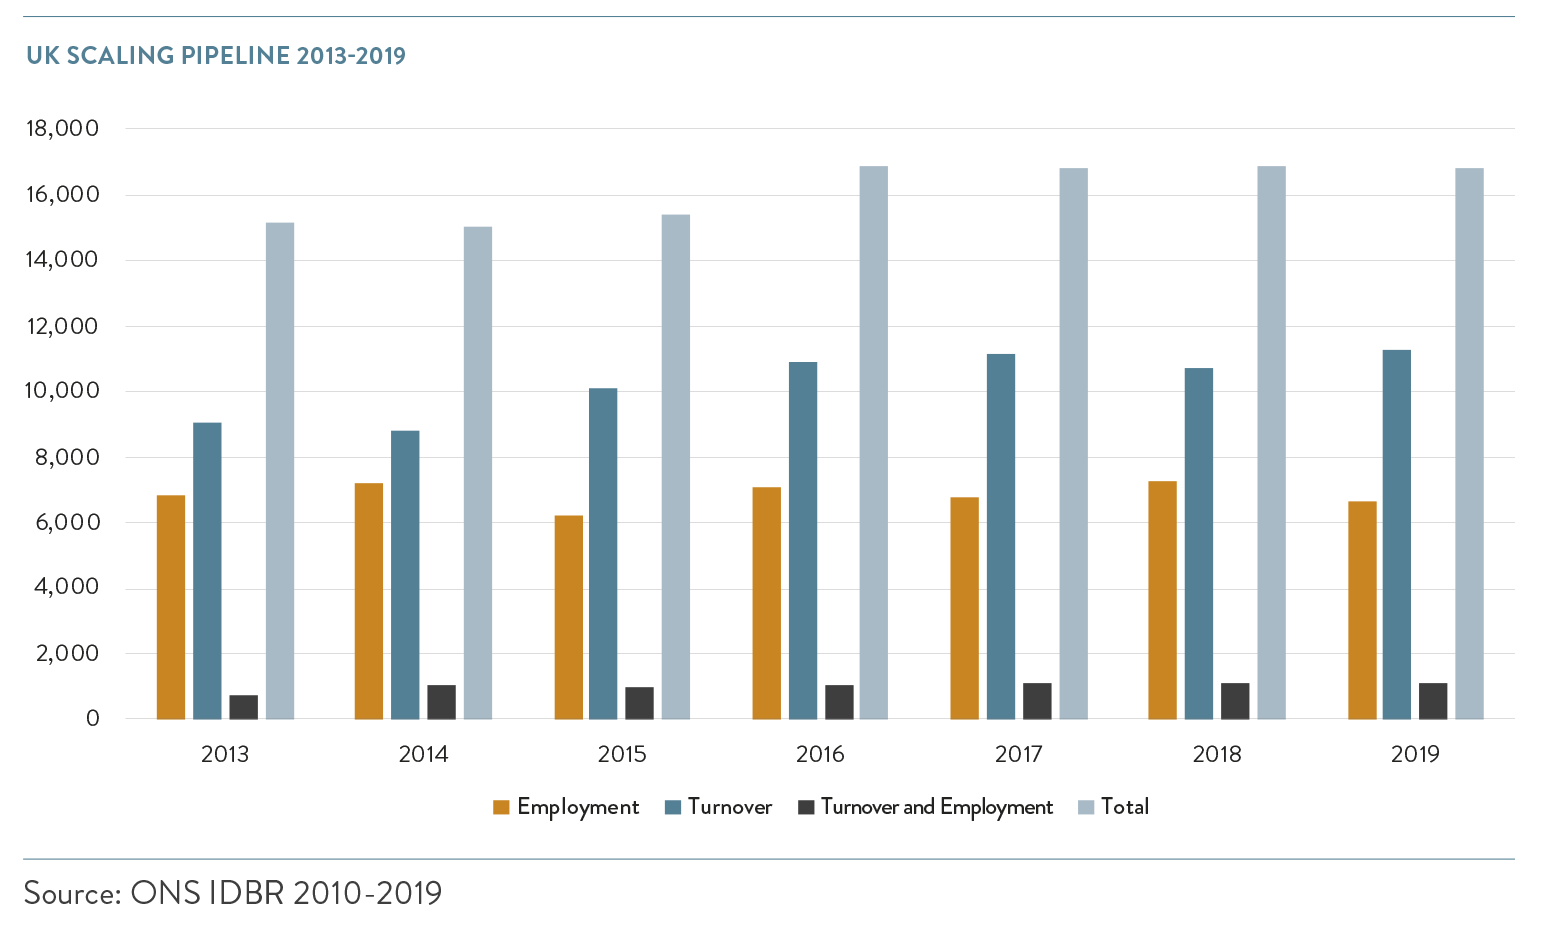
The Scaling Pipeline 2013-2019
In 2019, the number of businesses in the scaling pipeline showed a slight overall decline – from 16,890 to 16,830. There were declines in the numbers of businesses scaling by employment (9%) and by both turnover and employment (4%). This was offset by a 5% increase in businesses scaling by turnover.
That said, the number of total businesses in the scaling pipeline has been remarkably stable across time. From 2013-2015, it stayed around 15,000, rising to just below just below 17,000 in the 2016 to 2019 period, driven by an exceptional 10 % increase in the number of businesses in the scaling pipeline in 2015-2016.
Turnover and Employment Trends
The overall number of people employed by businesses in the scaling pipeline has increased by 6% from the start of the six-year period. However, in 2019 there was a decline in the overall number of employees for the first time in five years.
The number of businesses scaling by turnover increased by 24% from 2013 to 2019. This was primarily due to a 15% growth in their numbers in 2014-2015. That said, the turnover value has fluctuated widely but, at £474bn in 2019, remains substantial.
| Years | Employees | Turnover (£bn) |
| 2013 | 1,580,147 | 502 |
| 2014 | 1,452,556 | 390 |
| 2015 | 1,552,261 | 283 |
| 2016 | 1,742,564 | 301 |
| 2017 | 1,763,565 | 381 |
| 2018 | 1,882,731 | 592 |
| 2019 | 1,676,370 | 474 |
Local area pipelines
At the LEP and Devolved Nation level, we saw little change in the scaling pipeline relative to 2018:
- The top five LEPs/devolved nations by number of scaling pipeline businesses were the same in 2019 as 2018: London, Scotland, South East, Greater Manchester and Wales.
- Four of the bottom five LEPs/devolved nations by number of scaling pipeline businesses were the same in 2019 as 2018: Tees Valley, Cumbria, Swindon and Wiltshire, and Worcestershire.
- The areas showing the biggest increases in number of scaling pipeline businesses in 2019 were Northern Ireland, London, Enterprise M3, Heart of the South West and Black Country
- The areas with the greatest decrease in the number of scaling pipeline businesses in 2019 were New Anglia, South East Midlands, Greater Birmingham and Solihull, Greater Manchester, Swindon and Wiltshire, and the West of England.
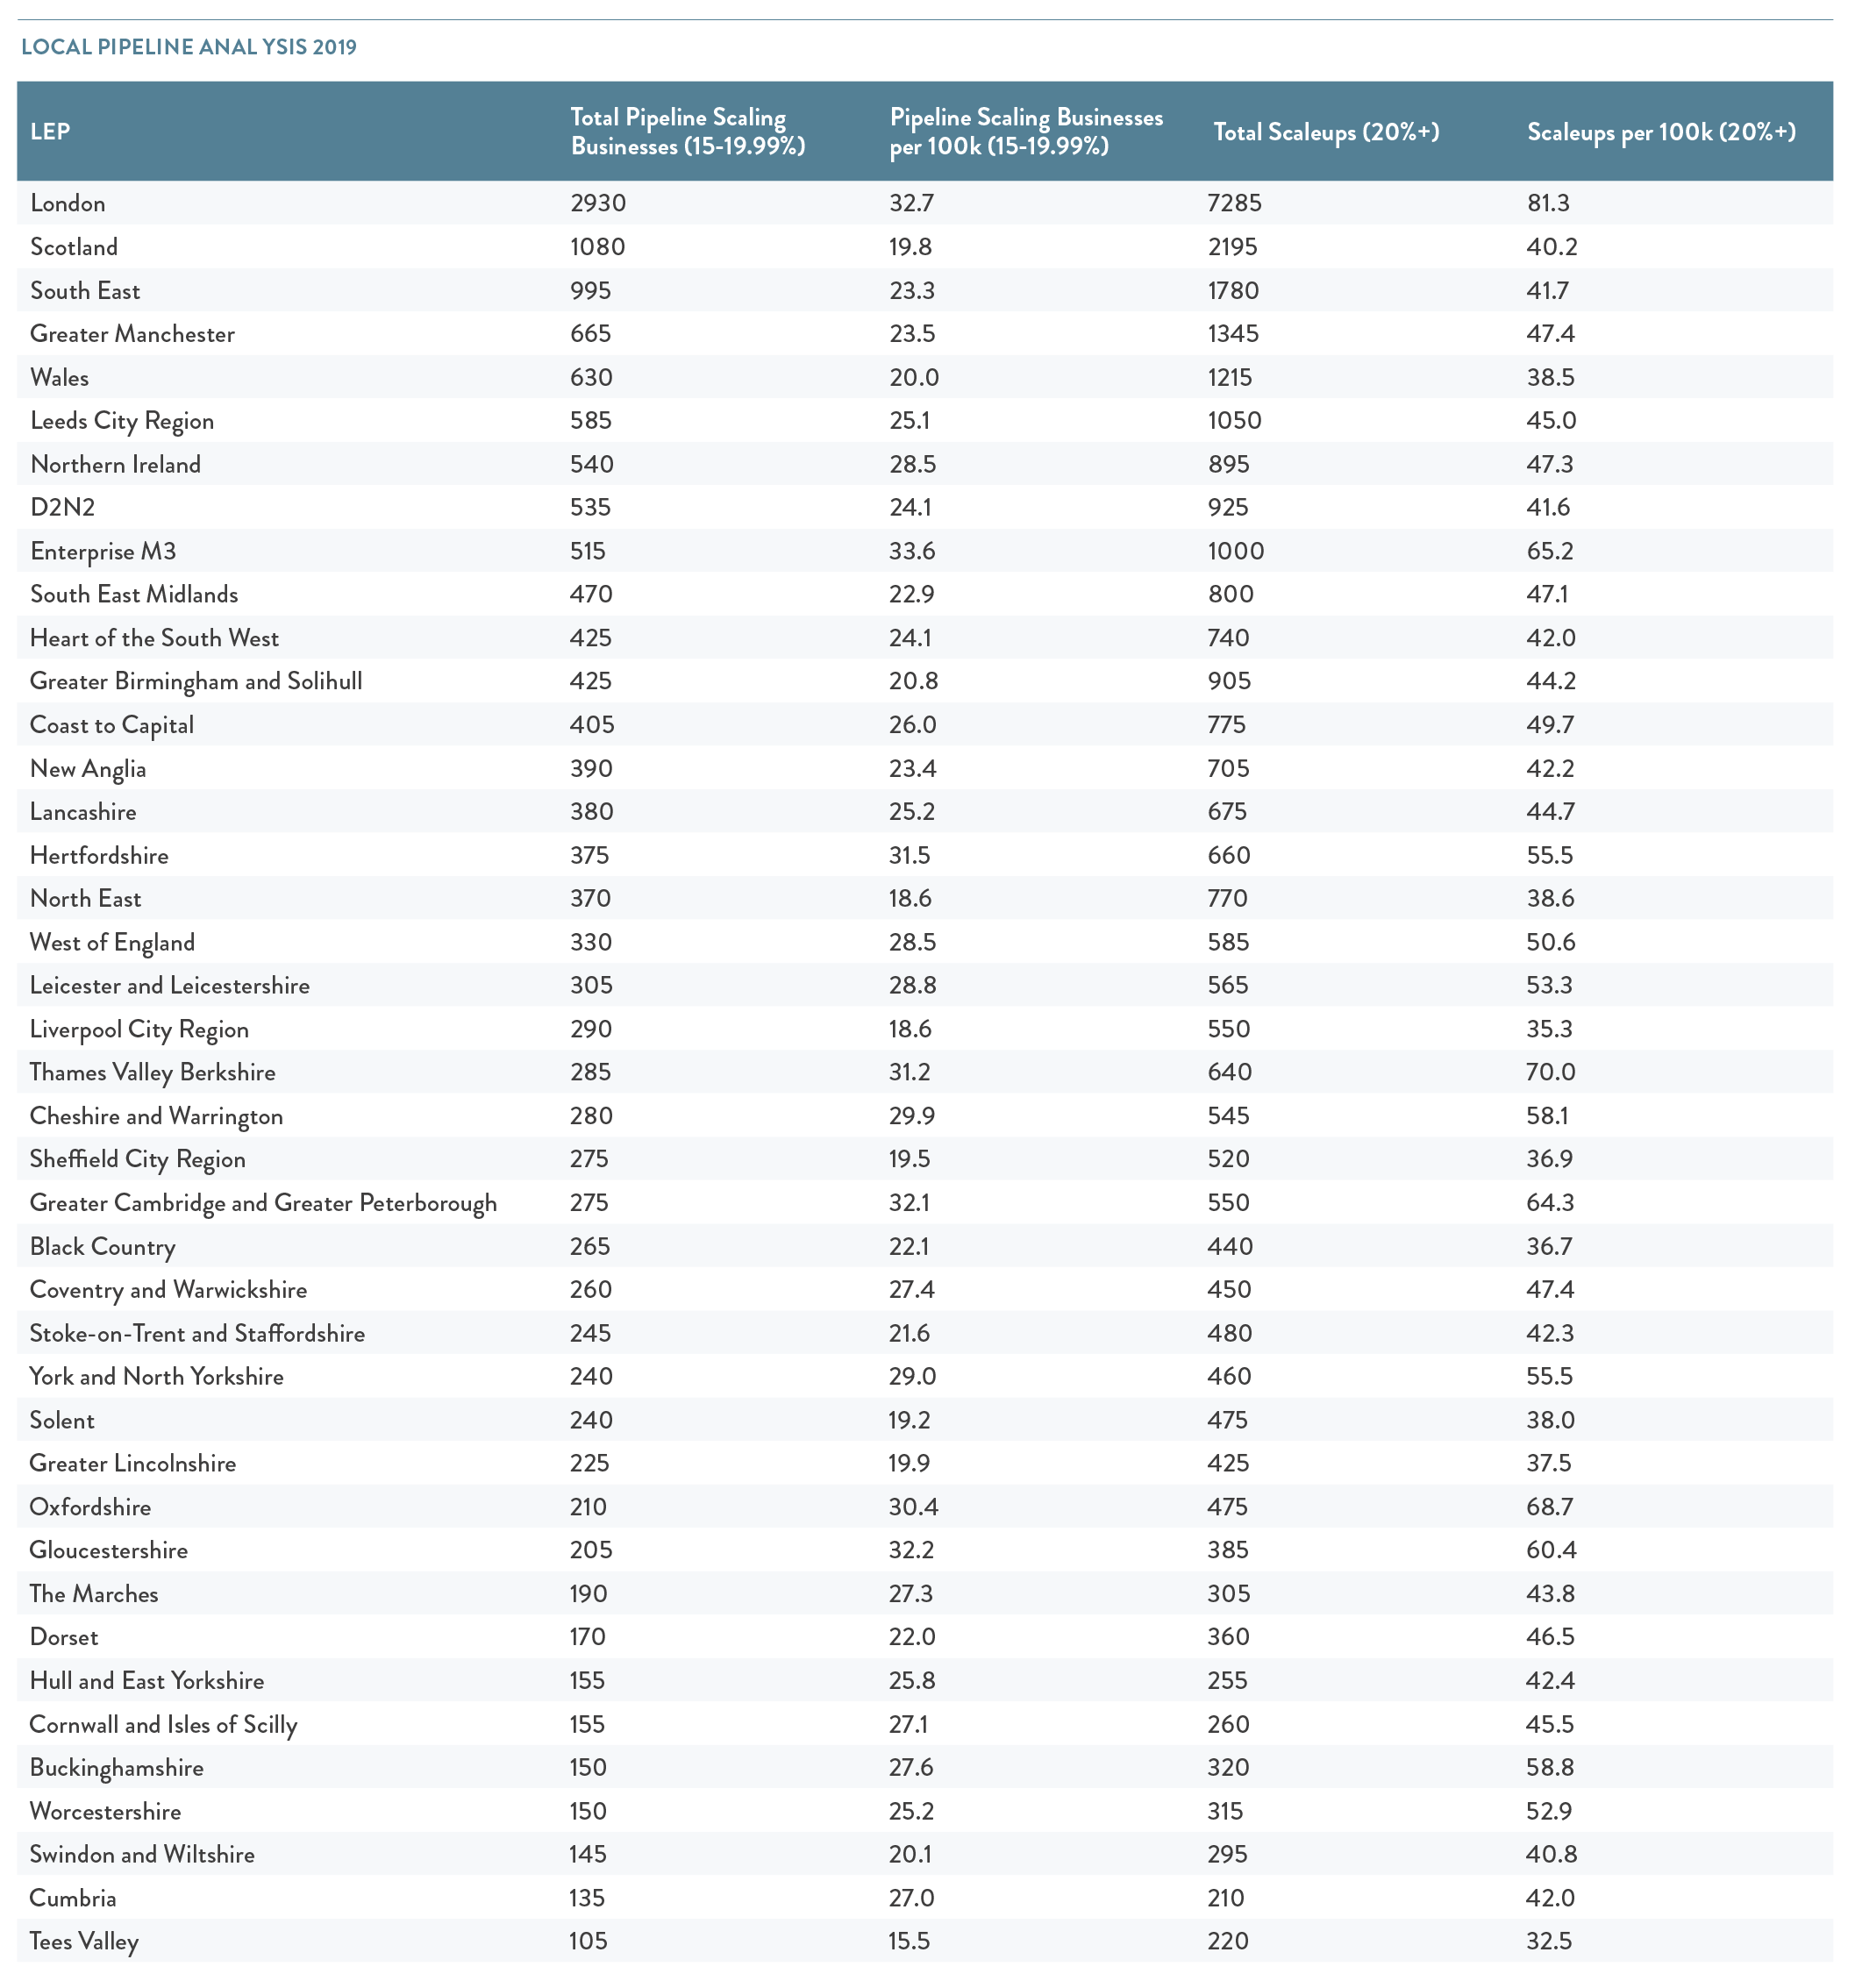
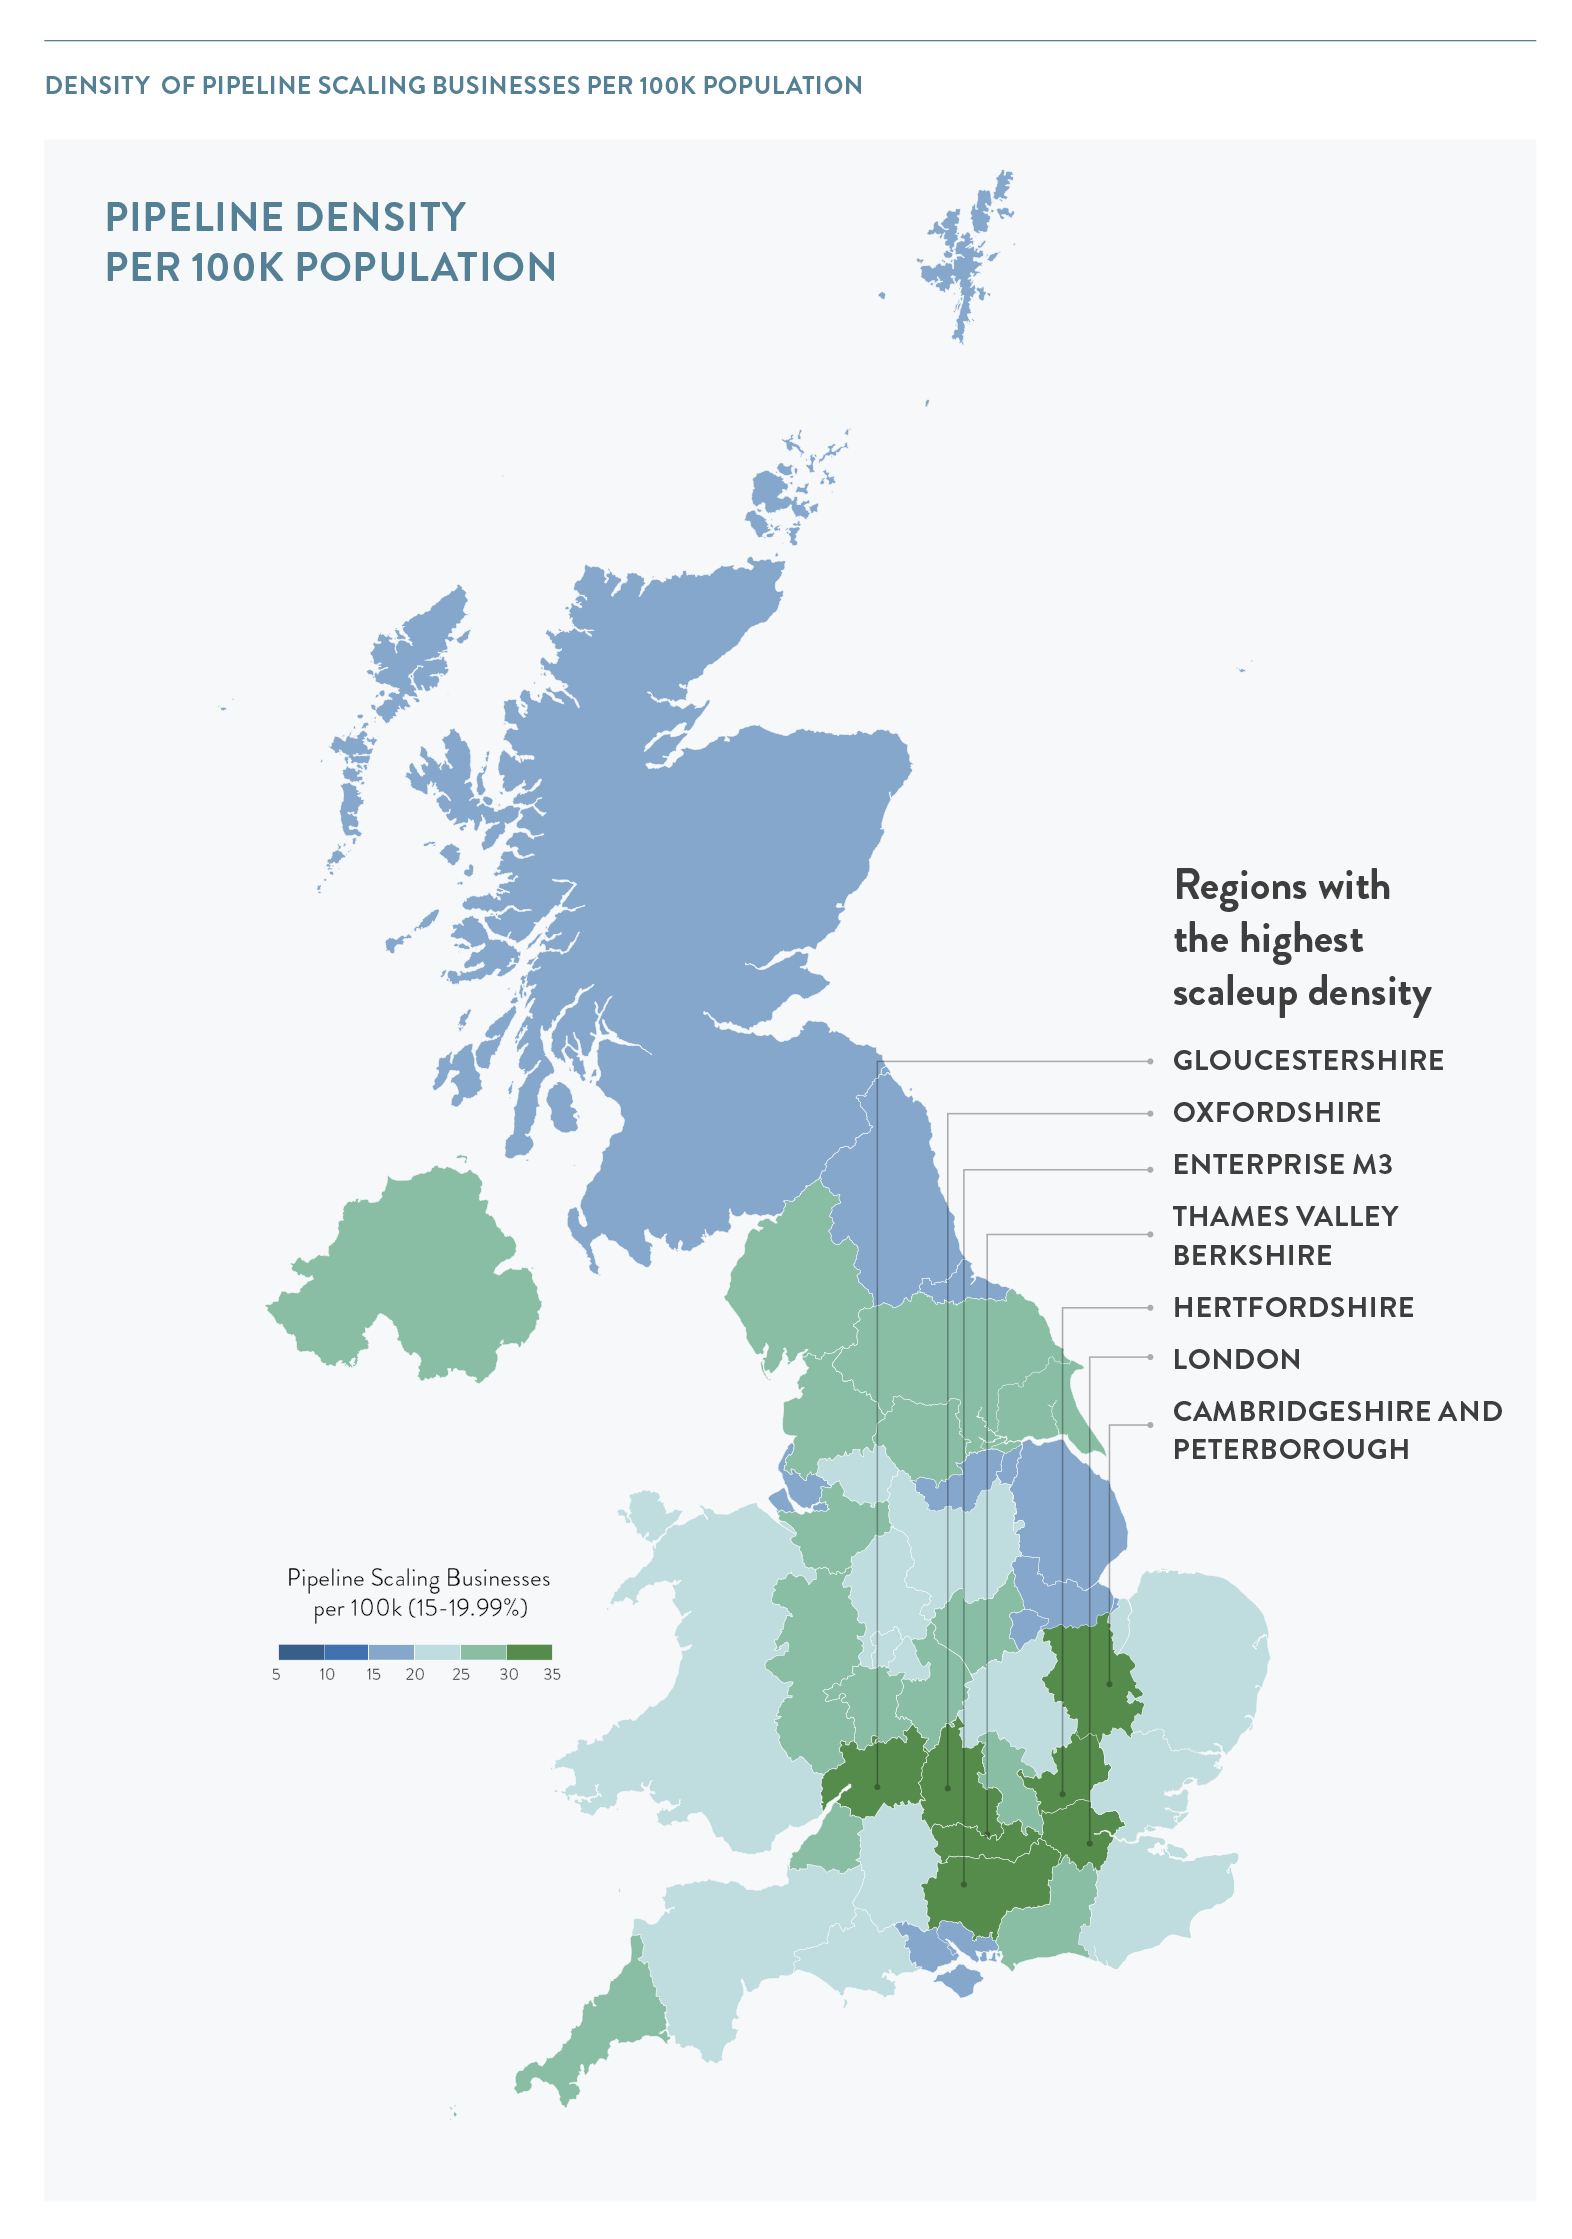
Density of pipeline scaling businesses per 100k population
- The 5 LEP/devolved nations that saw the greatest increase in scaling pipeline density in 2019 were: Northern Ireland, The Marches, Black Country, Coventry and Warwickshire, and Enterprise M3.
- The 5 LEP/devolved nations that saw the greatest decrease in scaling pipeline density in 2019 were: Buckinghamshire, Swindon and Wiltshire, Cornwall and Isles of Scilly, New Anglia and Dorset
- 9 of the top 10 LEPs/devolved nations by scaleup density also had the highest density of scaling pipeline businesses.
- 9 of the bottom LEPs/devolved nations by scaleup density also had the lowest density of scaling pipeline businesses.
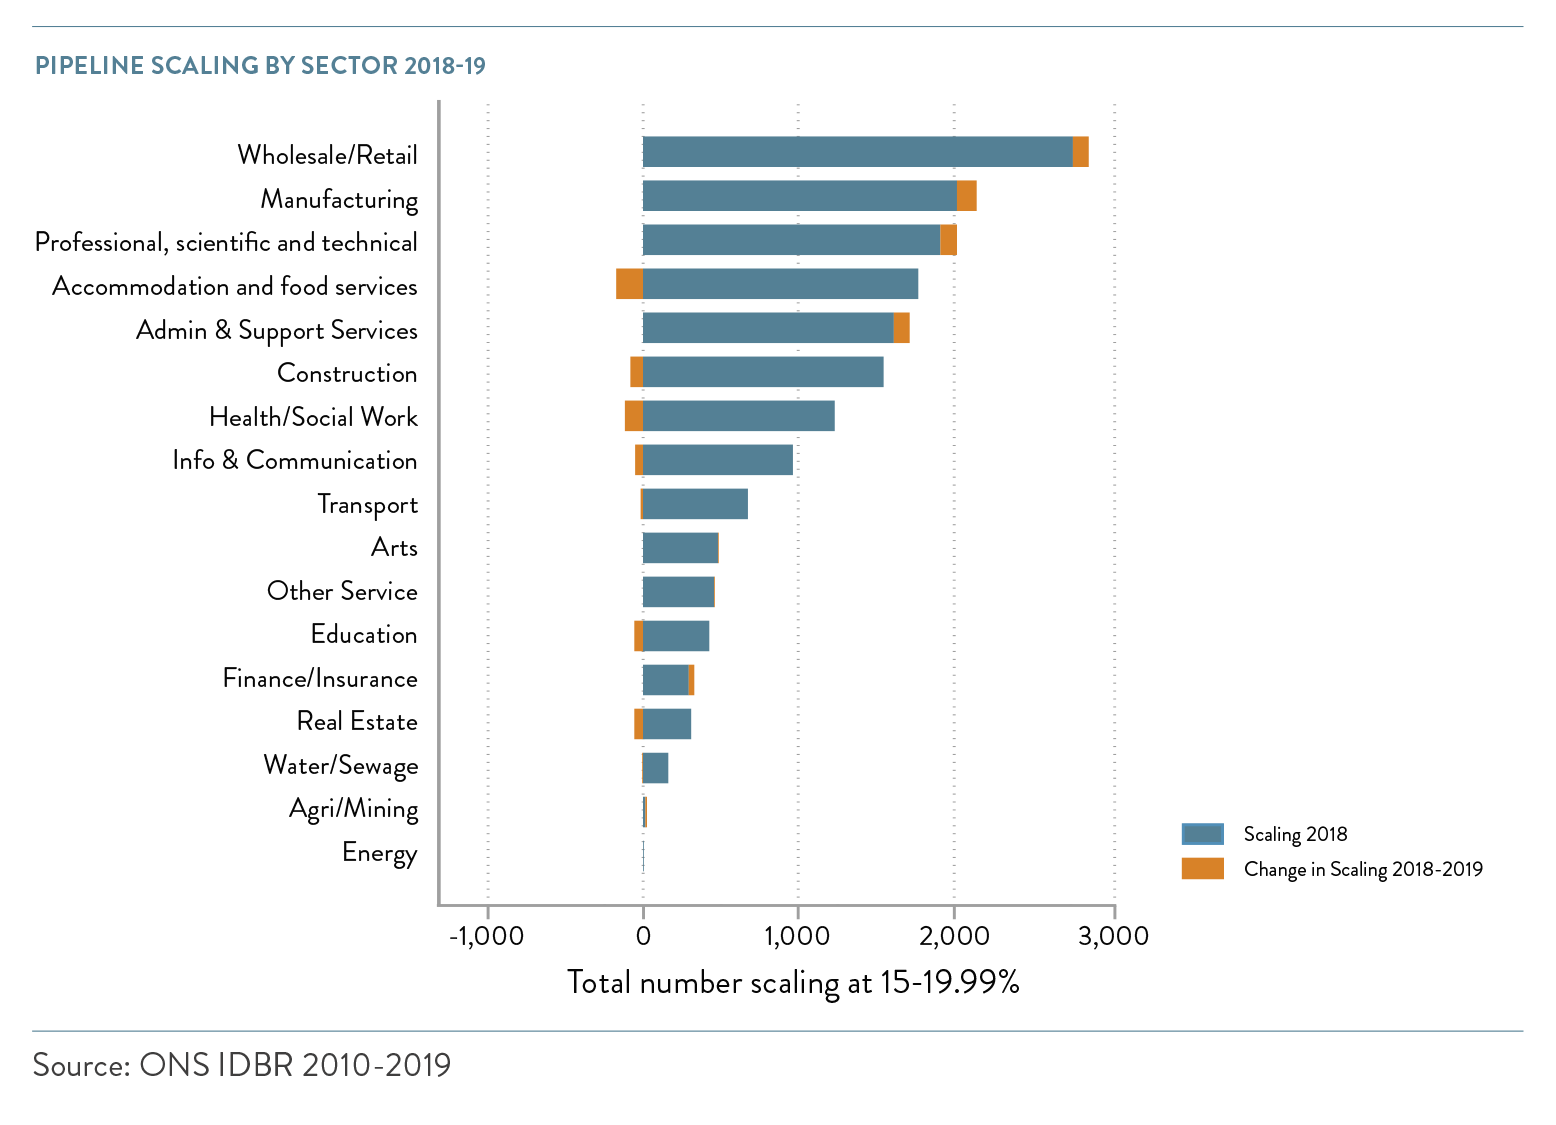
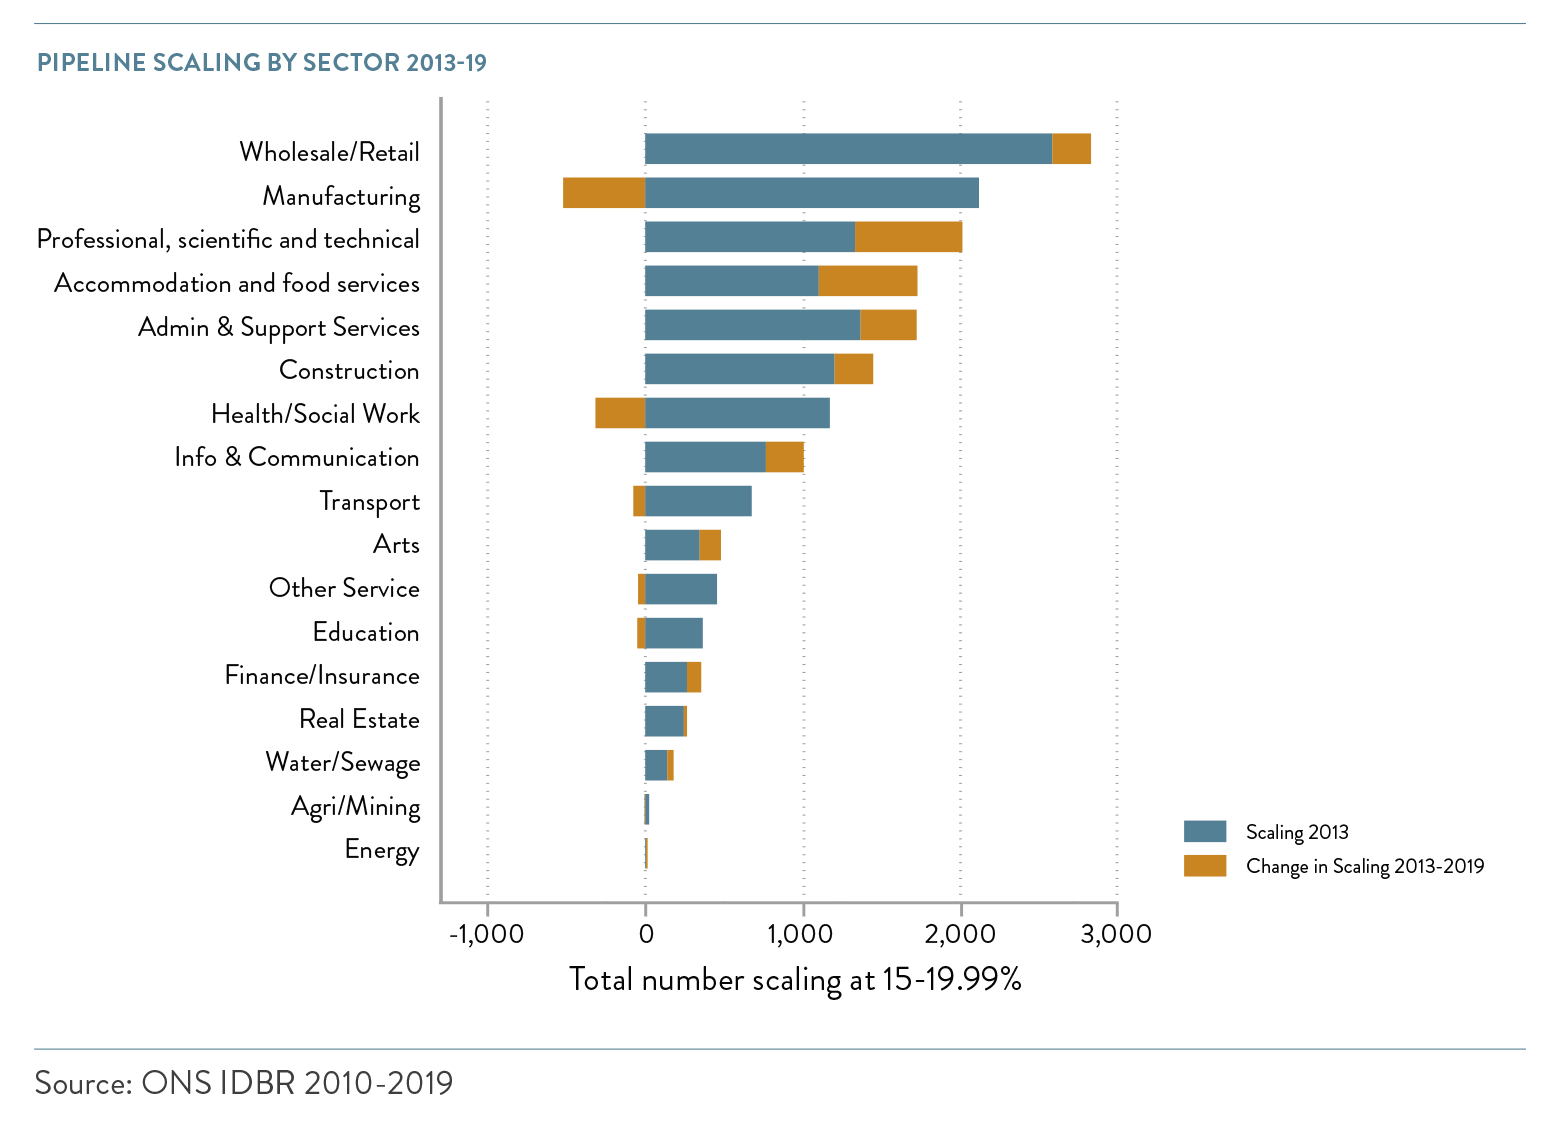
The Scaling Pipeline by Sector
Three of the four highest growth sectors for scaleups in 2019 were also the highest growth sectors for scaling businesses. These were: Manufacturing; Professional, Scientific & Technical; and Wholesale/Retail. Health/Social Work declined significantly in both scaleups and pipeline scaling businesses.
However, not all sectors shared the same close relationship between their scaling pipeline and scaleups:
- The number of scaling businesses in Information & Communication declined – but the number of scaleups increased.
- The number of scaling businesses in Administrative & Support Services increased – but remained steady for scaleups.
- The biggest decline in scaling businesses came from Accommodation and Food Services – a sector which saw only a modest decline among scaleups.
When we analyse scaling businesses across the six-year period from 2013 to 2019, the sectors with the largest absolute gains were Professional, Scientific & Technical; Accommodation and Food Services; Admin & Support Services; Construction; and Wholesale/Retail. Apart from Construction, these sectors were also the top five highest growth sectors for scaleups.
Manufacturing saw the largest decline from 2013 to 2019 in both scaling businesses and scaleups. While the number of scaleups in Health/Social Work grew significantly in this period, this sector saw the second largest decline in scaling businesses.
CONTENTS
Introduction 2021
Chapter 1 2021
The ScaleUp Business Landscape
Chapter 2 2021
Leading Programmes Breaking Down the Barriers for Scaleups
Chapter 3 2021
The Local Scaleup Ecosystem
Chapter 4 2021
The Policy Landscape
Chapter 5 2021
Looking forward
Annexes 2021
Scaleup Stories 2021


Share